Our system will evaluate the answer based on this AI-generated description.
The image contains two bar graphs, the first titled "Trust in News Sources" and the second "News Sources Used". The first graph shows the percentage of responses for "Highly Trust" and "Don't Trust" for six news sources. Local TV news has 52% Highly Trust, 41% Don't Trust; National network has around 50% Highly Trust, 44% Don't Trust; Newspapers have 47% Highly Trust, 45% Don't Trust; Radio news has around 47% Highly Trust, 46% Don't Trust; Online-only sources have around 40% Highly Trust, 54% Don't Trust; Magazines have 38% Highly Trust, 58% Don't Trust. The second graph displays the percentage of "News Sources Used in Past Week". Local TV news has around 85% usage; National network around 65% usage; Newspapers around 58% usage; Radio news around 52% usage; Online-only sources around 75% usage; Magazines around 40% usage. The exact percentages are not visible; estimations are made based on the bar length in the graph.
Given the complexity of the image, the above description may not be entirely accurate.
Skyrocket your IELTS band score by 1-2 points in under a month with our premium plan!
Note: Both the topic and the answer were created by one of our users.
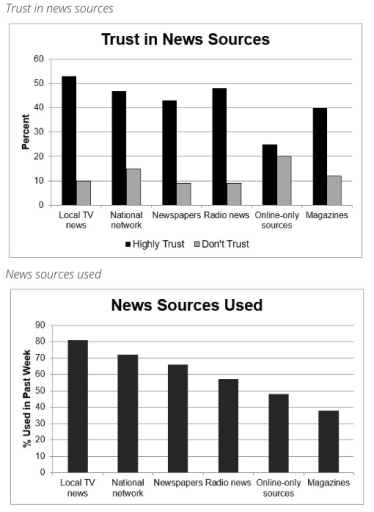
The bar graphs illustrate the percentage of people’s news sources in the past week and the credibility of the sources for them.
Overall, it can clearly be seen that citizens predominantly received information from local television news. Additionally, most of them trusted the origin of their news.
In terms of media for news, the local news peaked at 80%, followed by the national networks at just above 70%. Furthermore, the newspapers and radio news was moderately popular, at roughly 65% and approximately 55%, respectively. In addition, online-only sources and magazines were the last resort for citizens to get news, with just above 50% and just below 40% respectively.
Regarding the credibility of the news sources, local news television was the most reliable where around 55% trusted it, followed by radio news and national networks at around 45%. Thereafter, the percentage of newspapers and magazines was just above 40% and precisely 40%, respectively. On the other hand, information from online-only sources was trusted by only around 25%, whereas its distrust percentage was the highest at precisely 20%.
Word Count: 176