Our system will evaluate the answer based on this AI-generated description.
The image has two stacked bar graphs labeled "Weight assessment of inhabitants of Charlestown 2015" and "Weight assessment of inhabitants of Charlestown 1955"; both have the same five categories for age range '20-29', '30-39', '40-49', '50-59', '60-69' on the x-axis and a vertical percentage scale from 0% to 100% on the y-axis, divided into four weight categories 'underweight', 'ideal', 'overweight', 'obese'. The 2015 graph data: '20-29' age range 15% underweight, 20% ideal, 45% overweight, 20% obese; '30-39' age range 10% underweight, 25% ideal, 40% overweight, 25% obese; '40-49' age range 5% underweight, 20% ideal, 50% overweight, 25% obese; '50-59' age range 5% underweight, 25% ideal, 45% overweight, 25% obese; '60-69' age range no underweight, 30% ideal, 40% overweight, 30% obese. The 1955 graph data: '20-29' age range 40% underweight, 40% ideal, 15% overweight, 5% obese; '30-39' age range 30% underweight, 45% ideal, 20% overweight, 5% obese; '40-49' age range 20% underweight, 50% ideal, 25% overweight, 5% obese; '50-59' age range 10% underweight, 55% ideal, 25% overweight, 10% obese; '60-69' age range 5% underweight, 50% ideal, 35% overweight, 10% obese.
Given the complexity of the image, the above description may not be entirely accurate.
Skyrocket your IELTS band score by 1-2 points in under a month with our premium plan!
Note: Both the topic and the answer were created by one of our users.
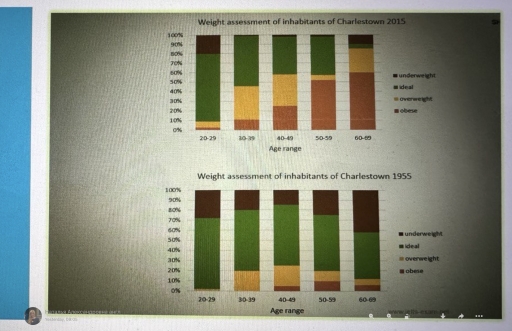
The bar charts compare the different body indexes of citizens in Charlestown between 1955 and 2015.
Overall, in 1955, most of Charlestown residents had ideal weight in all age categories. Subsequently, in 2015, people gained more weight and became obese.
It can be seen from the graph, the percentage of people with the ideal weight was around 70% and 80% in 1955 and 2015 respectively. However, the precent of obese increased slightly to 3% in 2015. In the age between 30-39, 60% of residents had their ideal weight in 1955, but having been eating, the percentage of overweighing only increased to 2015. In particular under weighted people accounted for 20%, but it fell rapidly to 1% in 2015.
Obese became the major issue in every age ranges, starting from 20 and ending with 69 years old, the percentage of which, had increased moderately to 2015. The obese index was amounted to just under 30% in 2015, while in 1955 it was constituted to only 4% in the age between 40-49. Afterwards, citizens from 50-59 and 60-69 had the highest obese percent in 2015 which was total to 50% and 60% respectively.
Word Count: 191