Our system will evaluate the answer based on this AI-generated description.
The image presents two graphs related to rice in X Country, with timelines from 1990 to 2040. The top graph, marking "Rice Production" in solid lines and "Rice Consumption" in dashed lines, displays a quantitative increase in million tons: production rises from roughly 25 in 1990, stays near 50 in 2010 and 2020, anticipated to escalate near 75 by 2040; consumption initiates around 20 in 1990, approximates 40 by 2010 and 2020, predicting a rise to about 60 by 2040. The bottom graph contrasts the percentages of "Rice" versus "Other Food Crops" consumed over the same periods: in 1990, Rice accounts for nearly 45%, other crops at 55%, in 2000, rice slightly drops below 40%, other crops surpassing 60%, by 2010 rice ascends back to 45%, maintaining a balance near 55% for other crops, displaying a notable increase in rice at about 55% with other crops lessening around 45% for 2020, with a speculated continuous trend leading to 2040 showing rice possibly near 60% and other crops at 40%.
Given the complexity of the image, the above description may not be entirely accurate.
Skyrocket your IELTS band score by 1-2 points in under a month with our premium plan!
Note: Both the topic and the answer were created by one of our users.
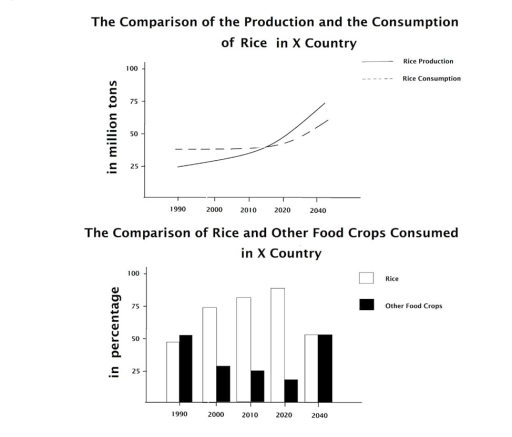
The bar chart compares the rice and other food crops used in X country, while the line graph illustrates the production and expenditure of rice in X country from 1990 to 2040.
Overall, it is quite evident that the number of rice production and consumption increased over the period of time. From the bar chart the number of rice was the highly consumed, whereas the least was consumed from other food crops over the given period of time.
It can be clearly seen from line chart the production of rice was 25 million tons, while rice consumption was around 35 million tons. From 1990 to 2015, the production of Rice increased from 25 to 35 million tons, whereas rice consumption remained stable till 2020. Furthermore the production and consumption will increase to 45 and approximately 60 million tons from 2015 to 2040.
Turning to the bar chart, in 1990 the consumption of rice was around a half (50%), this figure will increase to around 55% in 2040. Furthermore, the consumption of other food crops was 55% in 1990, this figure will remain stable in 2040.
Word Count: 185
