🔥 Today Only: Save 30% on Premium — Offer Ends Soon! - Upgrade Now!
Process Diagram

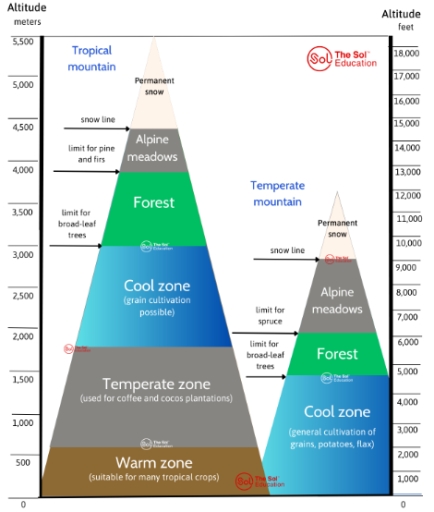
Band 5+: The diagram shows differences in temperature zones between tropical mountains and temperate mountains. Summarise the information by selecting and reporting the main features, and make comparisons where relevant.

Image for topic: The diagram shows differences in temperature zones between tropical mountains and temperate mountains. Summarise the information by selecting and reporting the main features, and make comparisons where relevant.
Our system will evaluate the answer based on this AI-generated description.
The image depicts two triangular diagrams representing tropical and temperate mountain altitudes, divided into various ecological zones. Tropical mountain altitude ranges from 0 to 5,500 meters (18,000 feet). Warm zone is 0-1,000 meters (0-3,300 feet) for tropical crops. Temperate zone is 1,000-2,000 meters (3,300-6,600 feet) for coffee and cocos. Cool zone is 2,000-3,000 meters (6,600-10,000 feet) for grain cultivation. Forest begins at 3,000 meters (10,000 feet), with a limit for broad-leaf trees at 3,500 meters (11,500 feet) and pine and firs limit at 4,000 meters (13,000 feet). Alpine meadows start at 4,000 meters (13,000 feet), snow line is at 5,000 meters (16,500 feet), and permanent snow begins at 5,500 meters (18,000 feet). Temperate mountain altitude ranges from 0 to 3,500 meters (12,000 feet). Warm zone is 0-500 meters (0-1,500 feet), Temperate zone is 500-1,000 meters (1,500-3,000 feet), Cool zone is 1,000-1,500 meters (3,000-5,000 feet) for grains, potatoes, flax. Forest begins at 1,500 meters (5,000 feet), with a limit for broad-leaf trees at 2,000 meters (6,500 feet) and spruce limit at 2,500 meters (8,500 feet). Alpine meadows start at 2,500 meters (8,500 feet), snow line is at 3,000 meters (10,000 feet), and permanent snow begins at 3,500 meters (12,000 feet).
Given the complexity of the image, the above description may not be entirely accurate.
Note: Both the topic and the answer were created by one of our users.

The diagram illustrates the comparison of temperature zones between two different kind of mountains: tropical mountain and temperature mountain.

It is clear that the height of temperature mountain is shorter than tropical mountain. As tropical mountain has more 2 layers compare to temperature mountain.

In terms of temperature mountain, the height of temperature mountain is only 11.500 feet which half shorter than tropical mountain. The cool zone is the lowest based of temperature mountain, whereas this zone is at the third layer in tropical mountain. At the cool zone of temperature mountain mainly plants grains, potatoes and flax, while at tropical forest has warm zone and temperature zone which suitable for planting tropical crops, coffee and cocoa.

The forest locates at the forth layer of tropical mountain which locates from 11.000 to 14.000 meters, doubling the forest area at temperature mountain. Meanwhile, the Alpine meadows at tropical zone just at 14.000 to 16.000 meters that the width of this zone is shorter than at temperature mountain.

Word Count: 166

Answers On The Same Topic:

The diagram shows differences in temperature zones between tropical mountains and temperate mountains. Summarise the information by selecting and reporting the main features, and make comparisons where relevant.

The diagram illustrate how temperature zones differ by altitude (measured in both meters and feet) between tropical and temperate mountains. Overall, the tropical mountain exhibits a more diverse range of altitude-based temperature zones and contains more distinct ecological zones compared to the temperate mountain. Furthermore, the permanent show line is positioned at a much higher […]

The diagram shows differences in temperature zones between tropical mountains and temperate mountains. Summarise the information by selecting and reporting the main features, and make comparisons where relevant.

The diagram illustrates how temperature zones differ by altitude ( meters-m and feet-f) between tropical and temperature mountains. Overall, the tropical mountain has a wider range of altitude-based temperature zones compared to the temperature mountain, and contains more distinct ecological zones. Meanwhile, the permalent snow line is positioned at a much higher elevation in the […]

The diagram shows differences in temperature zones between tropical mountains and temperate mountains. Summarise the information by selecting and reporting the main features, and make comparisons where relevant.

The diagram compares tropical and temperate mountains in terms of their vegetation. Overall, in tropical regions vegetation will grow at higher altitudes compared with temperate regions. Mountains in tropical regions support more diverse zones than in temperate regions. There is a snow line at about 2800 metres (10,000 feet) on temperate mountains and there is […]

The diagram shows differences in temperature zones between tropical mountains and temperate mountains. Summarise the information by selecting and reporting the main features, and make comparisons where relevant.

The diagram illustrates the variations between the features of tropical mountains and temperate mountains in different altitudes. Overall, while both temperate mountains and tropical mountains are divided into four different sections, they have different sizes of each layer. Notably, while tropical mountains have a larger area for most part than temperate mountains, the only exception […]

The diagram shows differences in temperature zones between tropical mountains and temperate mountains. Summarise the information by selecting and reporting the main features, and make comparisons where relevant.

The diagram illustrates the variations between the features of tropical mountains and temperate mountains in different altitudes. Overall, while both temperate mountains and tropical mountains are divided into four different parts, they have different sizes of each layer. Notably, while tropical mountains have a larger area for most part than temperate mountains, the only exception […]

See All

Other Topics:

The diagram shows how usable crushed automobile parts are recycled but other pieces are thrown away.

The illustration depicts what happens with the damaged parts from automobiles and how metalic pieces are recycled; meanwhile plastics are thrown away. Overall, the metal is separated from the pile of damaged wastage and recycled for using it again in the automobile industries. In contrast, the plastic bits are thrown away without any further processing. […]

The given diagram illustrates the entire manufacturing process of converting sugar cane to sugar, which takes place in seven different steps.

The diagram illustrates the process of producing sugar from sugar cane.Overall, there are seven main stages, beginning with the cultivation of sugar cane and ending with the drying and cooling of the final sugar crystalls. First,sugar cane is grown in fields for approximately 12 to 18 months,untill it reaches maturty.Once it is ready to be […]

The diagrams show the life cycle of a species of large fish called the salmon. Summarize the information by selecting and reporting the main features, and make comparisons where relevan

The diagrams below show the life-cycle of a species of fish named salmon.The diagram includes the three main stages in the life of the fish and the three types of environment where they live. After hatching from their eggs, newborn salmon fish-otherwise known as fry-spend around four years of their life in the lower part […]

The diagram below describes the structure of a home smokery and how it works. Summarise the information by selecting and reporting the main features and make comparisons where relevant.

The diagram illustrates the structure and operation of a home smokery. Overall, this is a straightforward three-stage process that begins with fresh air entering an underground chamber and culminates in food being smoked inside a box at ground level. Initially, fresh air enters the chamber through an opening covered by a lid and flows along […]

The diagram below shows how the Australian Bureau of Meterology collects up to the minute information on the weather in order to produce reliable forecasts.

The diagram illustrates how the Australian Bureau of Meteorology produce reliable forecasts, using the information about weather. Overall, it can be clearly seen that the process of production reliable forecasts consists four stages: incoming information, analysis and forecasting, preparing the broadcast, and broadcast. The needed equipment is: a satellite, a radar, buoy, charts, a TV […]

The diagram presents the process of recycling glass bottles. Summarise the information by selecting and reporting the main features, and make comparisons where relevant.

The diagram illustrates the step-by-step process by which glass bottles are collected, recycled, and transformed into new products. Overall, it is clear that the glass recycling process is a continuous loop consisting of three main stages: collection and transportation, cleaning and sorting, and melting followed by remanufacturing into new containers for commercial sale. In the […]

See All
We have detected unusual activity on your device.
Please verify your identity to continue.
Note: This verification step won't sign you in. If you have a premium account, please log in to access the service as usual.
Google/Gmail Verification
Or verify using Email/Code
We've sent a verification code to:
youremail@gmail.com (Not your email?)
Enter it below to complete the verification process.
Ensure your email address is correct, your inbox is not full, and you check your spam folder. If no email arrives, consider using an alternative email.
You will need a Premium plan to perform your action!
Note: If you already have a premium account, please log in to access our services as usual.

Plans & Pricing

Our mission is to make quality education accessible for everyone.
However, to keep our hardworking team running and this service alive, we genuinely need your support!
By opting for a premium plan, not only do you sustain us in achieving the mission, but you also unlock advanced features to enrich your learning experience.

Free

For learners who aren't pressed for time

What's included on Free
100+ Cambridge IELTS Tests
Instant IELTS Writing Task 1 & 2 Evaluation (2 times/month)
Instant IELTS Speaking Part 1, 2, & 3 Evaluation (2 times/month)
Instant IELTS Writing Task 1 & 2 Essay Generator (2 times/month)
500+ Dictation & Shadowing Exercises
100+ Pronunciation Exercises
Flashcards
Other Advanced Tools

Premium

For those serious about advancing their English proficiency, and for IELTS candidates aspiring to boost their band score by 1-2 points (especially in writing & speaking) in just 30 days or less

What's included on Premium
Save Your IELTS Test Progress & Analyze Mistakes By Question Type
Save Your Own Flashcard Sets & Use Them On Any Device
Unlock All Courses, IELTS Tests, Section & Part Practice
Unlimited AI Conversations
Unlimited AI Writing Enhancement Exercises
Unlimited IELTS Writing Task 1 & 2 Evaluation
Unlimited IELTS Speaking Part 1, 2, & 3 Evaluation
Checked Answers Will Not Be Published
Unlimited IELTS Writing Task 1 & 2 Essay Generator
Unlimited IELTS Speaking Part 1, 2, & 3 Sample Generator
Unlimited Usage Of Advanced Tools & AI Features
Priority Support within 24h (12-month plan only)

Due to the nature of our service and the provided free trials, payments are non-refundable.