🔥 Today Only: Save 30% on Premium — Offer Ends Soon! - Upgrade Now!
Map

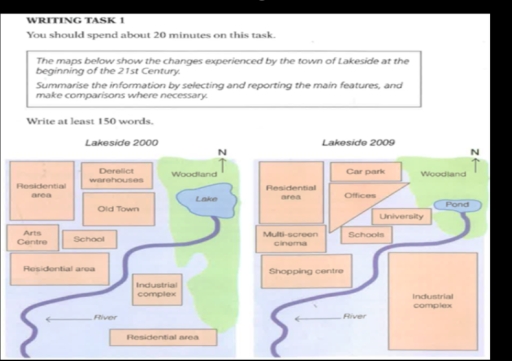
Band 5+: The diagram shows Lakeside development between years 2000 and 2009.

Image for topic: The diagram shows Lakeside development between years 2000 and 2009.
Our system will evaluate the answer based on this AI-generated description.
The image consists of two maps labeled Lakeside 2000 and Lakeside 2009, depicting changes in the town's infrastructure. In 2000, from north to south, there is a woodland, lake, old town, residential area, and river, with an arts center to the west, school to the east, industrial complex and two more residential areas to the south, and derelict warehouses to the southwest. By 2009, the northern woodland remains, but the lake is replaced by a pond, the old town becomes offices, the residential area transforms into a car park, and the school expands, with the addition of a university. The arts center becomes a multi-screen cinema, and a shopping center appears north of the southern river. The industrial complex and the southernmost residential area persist, while the central southern residential area and derelict warehouses vanish.
Given the complexity of the image, the above description may not be entirely accurate.
Note: Both the topic and the answer were created by one of our users.

The maps illustrate the changes that ocurred in Lakeside from 2000 to 2009

Overall, it is readily apparent that the significant change that was observed was the expansion of an industrial complex and the shrinking of the lake, with the transition of many locations. Moreover, many areas remained untouched

Looking first at the right of the river, intially, there were two locations. However, in 2009, the disapperance of a residental area has been necessitated to be in favor of the expansion of the industrial complex, accouting for most of the area. Furthermore, in the end of the river, the lake was narrowed to become a pond

regarding the left of the river, the dereclict warehouses in northernmost area has been completely replaced by a car park , with the transformation of a art centre in te left-hand side into a multi-screen cinema and the change of residential area into a shopping center under these area. The old town in the midsection was half cleaned to construct a university. Moreover, the schools were adjoining to the lake and the residential area in the northwesternmost area remained unaltered

Word Count: 186

Answers On The Same Topic:

The diagram shows Lakeside development between years 2000 and 2009.

The maps illustrate the development that occurred in the town of Lakeside between 2000 and 2009. Overall, it is evident that the area underwent significant changes during this period, becoming more modern with the introduction of several new buildings and facilities. In 2000, the area was relatively simple and less developed. The center of the […]

The diagram shows Lakeside development between years 2000 and 2009.

In the given maps is displayed the town of Lakeside and his 9 years transition. In the southern area of the town the industrail complex had an expansion removing completly the residential area, also with this expansion a big chunk of the woodland territory was replaced by this facilty. Considering the lake, in the northen […]

The diagram shows Lakeside development between years 2000 and 2009.

The two maps illustrate the development of the area around the lake from 2000 to 2009. Compared to the 2000 map, the 2009 map shows that the lake was reduced in size and turned into a pond, the derelict warehouses and old town were replaced by new buildings such as a university and offices, the […]

The diagram shows Lakeside development between years 2000 and 2009.

The diagram illustrates the differences after a 9-year period in the town of Lakeside. Overall, from 2000 to 2009, the town of Lakeside was industrialized and had a number of new infrastructures, which strengthened the living standards of residents. In 2009, the space of the lake also declined considerably and became shrunk into a small […]

The diagram shows Lakeside development between years 2000 and 2009.

The maps demonstrate the transformation of the Lakeside area from 2000 to 2009. Overall, it can be seen that remarkable developments have taken place in the Lakeside area. The most noticeable changes are the expansion of the industrial complex and the replacement of the art centre. In the year 2000, the northern section of Lakeside […]

See All

Other Topics:

The diagram below shows the layout of school library 5 years ago and now.

The maps demonstrate the library’s original layout in the past and how it has been renovated today. Overall, the library underwent significant changes, mainly the addition of specialized rooms, a change in table configurations, and the relocation of some functional spaces. The classroom from five years ago has been replaced by an audio room. The […]

The maps below show recent archaeological findings at a historic site in 2004 and 2014. Provide an overview of the information by identifying and describing the key details, and include comparisons where appropriate.

The map shows archaeological discoveries at a historic site between the years 2004 and 2014. Overall, the historic site became much more developed over the ten years – a period. Many new ancient structures were discovered across the area, while the many features mostly remained. In 2004, a few structures were discovered. On the west […]

The table below gives information on consumer spending on different items in five different countries in 2005. Write a report for a university lecturer describing the information shown below. Make comparisons where relevant. Write at least 150 words.

The table graph illustrates the proportion of the consumer how much spending in different items in different countries. Overall,the table graph school and hospital areas are remains same position 2000 and 2025 also.The High street is also same in table graph in 2000 and 2025. In 2000 the School, playground, bank, hospital and trees are […]

The plans below show a student accommodation building 2010 and now. Summarise the information by selecting and reporting the main features, and make comparisons where relevant.

The given maps compare the difference that has been appeared in a student accommdation building between 2010 and 2026. Overall, there are remarkable changes throughout this period for example, many bedrooms were added now. In addition, there are unchanged places, which are the garden and the car parking. Looking first at the western part of […]

The maps below show the changes that have taken place in Winsbury Village between 1850 and 1950. Summarise the information by selecting and reporting the main features, and make comparisons where relevant.

The 2 maps presented shows the changes around the Winsbury Village from 1850 and 1950. These changes happen as technology and lives evolves and advance into a modernised civilisation. These changes include building a glassware factory, a railway station with train tracks and a bigger bridge that goes over the River Arlo One key changes […]

The plans below show findings at an archaeological site in 1890 and 1990.

The following plans illustreates illustrates discoveries at an archaeological site during the period 1890 and 1990. Overall, the findings at an archaeological site in 1890 was only two ancient houses and a sea on the right side of the map, and an ancient temple setting far down, away from the 2 houses, and having 3 […]

See All
We have detected unusual activity on your device.
Please verify your identity to continue.
Note: This verification step won't sign you in. If you have a premium account, please log in to access the service as usual.
Google/Gmail Verification
Or verify using Email/Code
We've sent a verification code to:
youremail@gmail.com (Not your email?)
Enter it below to complete the verification process.
Ensure your email address is correct, your inbox is not full, and you check your spam folder. If no email arrives, consider using an alternative email.
You will need a Premium plan to perform your action!
Note: If you already have a premium account, please log in to access our services as usual.

Plans & Pricing

Our mission is to make quality education accessible for everyone.
However, to keep our hardworking team running and this service alive, we genuinely need your support!
By opting for a premium plan, not only do you sustain us in achieving the mission, but you also unlock advanced features to enrich your learning experience.

Free

For learners who aren't pressed for time

What's included on Free
100+ Cambridge IELTS Tests
Instant IELTS Writing Task 1 & 2 Evaluation (2 times/month)
Instant IELTS Speaking Part 1, 2, & 3 Evaluation (2 times/month)
Instant IELTS Writing Task 1 & 2 Essay Generator (2 times/month)
500+ Dictation & Shadowing Exercises
100+ Pronunciation Exercises
Flashcards
Other Advanced Tools

Premium

For those serious about advancing their English proficiency, and for IELTS candidates aspiring to boost their band score by 1-2 points (especially in writing & speaking) in just 30 days or less

What's included on Premium
Save Your IELTS Test Progress & Analyze Mistakes By Question Type
Save Your Own Flashcard Sets & Use Them On Any Device
Unlock All Courses, IELTS Tests, Section & Part Practice
Unlimited AI Conversations
Unlimited AI Writing Enhancement Exercises
Unlimited IELTS Writing Task 1 & 2 Evaluation
Unlimited IELTS Speaking Part 1, 2, & 3 Evaluation
Checked Answers Will Not Be Published
Unlimited IELTS Writing Task 1 & 2 Essay Generator
Unlimited IELTS Speaking Part 1, 2, & 3 Sample Generator
Unlimited Usage Of Advanced Tools & AI Features
Priority Support within 24h (12-month plan only)

Due to the nature of our service and the provided free trials, payments are non-refundable.
Buy activation codes in bulk and give one to each learner. A code does not expire until it is used, and each subscription only starts counting once its code is entered, so you can buy now and hand them out later.

10+ codes: 10% off 25+ codes: 15% off 50+ codes: 20% off
The codes are emailed to your payment address as soon as the payment goes through, and are also shown on the confirmation page. A tax invoice is issued automatically at checkout — select Purchasing as a business there to put your organization's name and tax ID on it.
Nếu bạn là người Việt Nam và không có hoặc không muốn trả bằng credit/debit cards, bạn có thể thanh toán bằng phương thức chuyển khoản:


Chọn gói:
419,000₫ 277,000 ₫ cho gói 1 tháng (chỉ 9,233₫/ngày)
1,239,000₫ 597,000 ₫ cho gói 3 tháng (chỉ 6,633₫/ngày)
2,469,000₫ 1,027,000 ₫ cho gói 6 tháng (chỉ 5,706₫/ngày)
4,929,000₫ 1,417,000 ₫ cho gói 12 tháng (chỉ 3,936₫/ngày)


Sau khi chuyển khoản, vui lòng đợi trình duyệt tự động điều hướng bạn trở lại Engnovate và bạn sẽ ngay lập tức nhận được mã kích hoạt tài khoản premium.
Nếu có lỗi xảy ra, bạn có thể liên hệ với team thông qua một trong các phương thức: email đến helloengnovate@gmail.com hoặc nhắn tin qua facebook.com/engnovate.
Vì toàn bộ công cụ trên website đều có thể sử dụng thử miễn phí, Engnovate không hỗ trợ hoàn tiền.