24 Hours Only: Get 39% OFF on Our Premium Plan - Check Out Now!
Table

Band 5+: The first table below shows changes in the total population of New York City from 1800 to 2000. The second and third tables show changes in the population of the five districts of the city (Manhattan, Brooklyn, Bronx, Queens, Staten Island) over the same period. Summarise the information by selecting and reporting the main features, and make comparisons where relevant.

Image for topic: The first table below shows changes in the total population of New York City from 1800 to 2000. The second and third tables show changes in the population of the five districts of the city (Manhattan, Brooklyn, Bronx, Queens, Staten Island) over the same period. Summarise the information by selecting and reporting the main features, and make comparisons where relevant.
Our system will evaluate the answer based on this AI-generated description.
The image consists of three tables detailing population statistics for New York City and its districts across three selective years: 1800, 1900, and 2000. The first table displays New York City's total population, with figures: 79,216 in 1800, 3,437,202 in 1900, and 8,009,185 in 2000. The second table outlines Manhattan's population and its percentage relative to New York City's total population. Manhattan's population was 60,515 in 1800, accounting for 76% of New York City's population; in 1900 it recorded 1,850,093, comprising 54% of the total population; and in 2000 the population was 1,538,096, representing 19% of the total city population. The third table covers populations for other districts, namely Brooklyn, Bronx, Queens, and Staten Island, with respective populations: 18,701 in 1800 (24%), 1,587,109 in 1900 (46%), and 6,471,089 in 2000 (81%).
Given the complexity of the image, the above description may not be entirely accurate.
Note: Both the topic and the answer were created by one of our users.

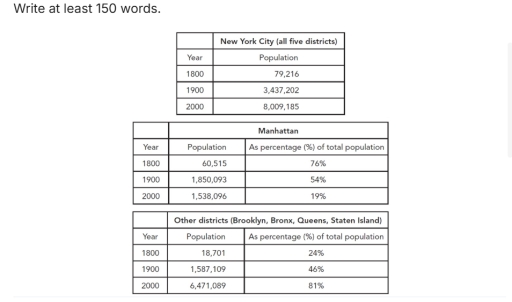
The given three tables illustrate changes in total population of 5 districts (Manhattan, Brooklyn, Bronx, Queens, and Staten Island) in New York and New York City, throughout two centuries, between 1800 and 2000.

Overall, the population has increased consistently all districts except Manhattan over the period.

The population of New York City in 1800, was 79,216 , while Manhattan’s population was 60,515, with 76% of total percentage. Meanwhile, Other 4 districts (Brooklyn, Bronx, Queens, and Staten Island) population was 18,701 , with 24% of total percentage in 1800.

In 1900,the population of New York city was 3,437,202, Manhattan’s population was 1,850,093 , with 54% of total population percentage and Other 4 districts were 1,587,109 ,with 46% of total percentage.

In 2000, New York city’s population was 8,009,185 recording the highest population among three centuries, while the population of Manhattan was 1,538,096 in 2000. Eventually, other 4 districts’ population was 6,471,089, with 81% of the total population percentage.

Word Count: 157

Answers On The Same Topic:

The first table below shows changes in the total population of New York City from 1800 to 2000. The second and third tables show changes in the population of the five districts of the city (Manhattan, Brooklyn, Bronx, Queens, Staten Island) over the same period. Summarise the information by selecting and reporting the main features, and make comparisons where relevant.

The first table chart demonstrates the population of New York City (all five districts) between 1800 and 2000.Likewise,the other tables illusrate the population of Manhattan and other districts such as:Brooklyn,Bronx,Queens,Staten Island,but with percentage. Overall,the number of citizen in New York City increased,as the percentage of total population of other districts,not including Manhattan.Compare to other dictricts […]

The first table below shows changes in the total population of New York City from 1800 to 2000. The second and third tables show changes in the population of the five districts of the city (Manhattan, Brooklyn, Bronx, Queens, Staten Island) over the same period. Summarise the information by selecting and reporting the main features, and make comparisons where relevant.

The tables illustrate changes in New York City’s population (1800-2000), breaking down figures for Manhattan and other districts (Brooklyn, Bronx, Queens, Staten Island). Overall, New York City’s population grew significantly, from 79000 in 1800 to 8000000 in 2000. There was a notable shift in population distribution, with Manhattan gradually losing its dominant position. At the […]

The first table below shows changes in the total population of New York City from 1800 to 2000. The second and third tables show changes in the population of the five districts of the city (Manhattan, Brooklyn, Bronx, Queens, Staten Island) over the same period. Summarise the information by selecting and reporting the main features, and make comparisons where relevant.

The provided tables illustrate shifts in the demographic distribution across New York City’s districts over two centuries, from 1800 to 2000. Overall, the city’s total population experienced a dramatic hundredfold increase across the period. Concurrently, the demographic dominance shifted decisively from Manhattan to the other four districts. In 1800, New York City’s population was under […]

The first table below shows changes in the total population of New York City from 1800 to 2000. The second and third tables show changes in the population of the five districts of the city (Manhattan, Brooklyn, Bronx, Queens, Staten Island) over the same period. Summarise the information by selecting and reporting the main features, and make comparisons where relevant.

The tables show how the population was distributed across New York City’s boroughs over a 200-year period, from 1800 to 2000. Overall, the total population grew enormously, while the main concentration of people shifted away from Manhattan to the other four boroughs. In 1800, the city’s total population was under 80,000, and Manhattan accounted for […]

The first table below shows changes in the total population of New York City from 1800 to 2000. The second and third tables show changes in the population of the five districts of the city (Manhattan, Brooklyn, Bronx, Queens, Staten Island) over the same period. Summarise the information by selecting and reporting the main features, and make comparisons where relevant.

The provided tables illustrate shifts in the demographic distribution across New York City’s boroughs over two centuries, from 1800 to 2000. Overall, the city’s total population experienced a dramatic hundredfold increase across the period. Concurrently, the demographic dominance shifted decisively from Manhattan to the other four boroughs. In 1800, New York City’s population was under […]

See All

Other Topics:

The table shows information about medical care in three different European countries between 1980 and 2000.

The table compares healthcare indicators in Austria, France, and Sweden between 1980 and 2000. Overall, Sweden consistently recorded the highest figures for physicians and hospital beds, while France showed a general decline in most categories. In contrast, Austria experienced gradual growth over the period. In terms of physicians, Sweden started at about 3.6 per 1,000 […]

The table below shows the amount of waste production (in millions of tonnes) in six different countries over a twenty-year period. Summarise the information by selecting and reporting the main features, and make comparisons where relevant.

The table illustrates the total of waste production in six different countries like Ireland,Japan,Korea,Poland,Portugal and US in 1980,1990 and 2000. It was measured in millions to tonnes. Overall,the most waste production in the whole period was in US. Whereas,the second most waste production was in Japan and finally the least waste production was in Ireland. […]

The table below shows the GDP, annual economic growth, and GDP per capita of the five largest economies in the world in 2019. Summarise the information by selecting and reporting the main features and making comparisons where relevant.

The data clearly explains the GDP, annual economic growth and GDP per capita of the five largest economies in the world in the year of 2019. Overall, the data consitute different numbers what five countries namely US, China, Japan, Germany and India contribute and how that influences their economy. The data depicts that US and […]

The tables below show people's reasons for giving up smoking, and when they intend to give up. Summarize the information by selecting and reporting the main features, and make comparisons where relevant.

The tables give information about the reasons why individuals’ quit smoking, and the time they decided to quit. Overall, giving up smoking because it is better for health in general, recorded the highest proportion among the reasons why smokers intended to give up smoking. Moreover, the largest number of individuals intended to quit smoking within […]

The table shows information about medical care in three different European countries between 1980 and 2000.

The table illustrates information about medical care in three categories in different countries from 1980 to 2000. Overall, it can be seen that Sweden had the highest figures among all the countries, while France had the lowest number of people requiring medical care, except in the category of average hospital stay. Additionally, the category with […]

The table shows information about students studying in six different departments at an Australian university in 2009. Summarise the information by selecting and reporting the main features, and make comparisons where relevant.

The given data represents the percentage of students studying at an Australian university, which is divided into 6 departments, in 2009. Overall, it can be seen that females mostly choose English department, meanwhile, the students whose first language is not English choose physics. About the students who were born outside of Australia basically go into […]

See All
We have detected unusual activity on your device.
Please verify your identity to continue.
Note: This verification step won't sign you in. If you have a premium account, please log in to access the service as usual.
Google/Gmail Verification
Or verify using Email/Code
We've sent a verification code to:
youremail@gmail.com (Not your email?)
Enter it below to complete the verification process.
Ensure your email address is correct, your inbox is not full, and you check your spam folder. If no email arrives, consider using an alternative email.
You will need a Premium plan to perform your action!
Note: If you already have a premium account, please log in to access our services as usual.

Plans & Pricing

Our mission is to make quality education accessible and free for everyone.
However, to keep our hardworking team running and this service alive, we genuinely need your support!
By opting for a premium plan, not only do you sustain us in achieving the mission, but you also unlock advanced features to enrich your learning experience.

Free

For learners who aren't pressed for time

What's included on Free
1000+ IELTS Tests & Samples
Instant IELTS Writing Task 1 & 2 Evaluation (2 times/month)
Instant IELTS Speaking Part 1, 2, & 3 Evaluation (5 times/month)
Instant IELTS Writing Task 1 & 2 Essay Generator (2 times/month)
500+ Dictation & Shadowing Exercises
100+ Pronunciation Exercises
Flashcards
Other Advanced Tools

Premium

For those serious about advancing their English proficiency, and for IELTS candidates aspiring to boost their band score by 1-2 points (especially in writing & speaking) in just 30 days or less

What's included on Premium
Save Your IELTS Test Progress
Unlock All Courses & Content
Unlimited AI Conversations
Unlimited AI Writing Enhancement Exercises
Unlimited IELTS Writing Task 1 & 2 Evaluation
Unlimited IELTS Speaking Part 1, 2, & 3 Evaluation
Checked Answers Will Not Be Published
Unlimited IELTS Writing Task 1 & 2 Essay Generator
Unlimited IELTS Speaking Part 1, 2, & 3 Sample Generator
Unlimited Usage Of Advanced Tools

Due to the nature of our service and the provided free trials, payments are non-refundable.
Nếu bạn là người Việt Nam và không có hoặc không muốn trả bằng credit/debit cards, bạn có thể thanh toán bằng phương thức chuyển khoản:


Chọn gói:
279,000₫ 157,000 ₫ cho gói 1 tháng (chỉ 5,233₫/ngày)
819,000₫ 397,000 ₫ cho gói 3 tháng (chỉ 4,411₫/ngày)
1,649,000₫ 667,000 ₫ cho gói 6 tháng (chỉ 3,706₫/ngày)
3,299,000₫ 857,000 ₫ cho gói 12 tháng (chỉ 2,381₫/ngày)


Sau khi chuyển khoản, vui lòng đợi trình duyệt tự động điều hướng bạn trở lại Engnovate và bạn sẽ ngay lập tức nhận được mã kích hoạt tài khoản premium.
Nếu có lỗi xảy ra, bạn có thể liên hệ với team thông qua một trong các phương thức: email đến helloengnovate@gmail.com hoặc nhắn tin qua facebook.com/engnovate.
Vì toàn bộ công cụ trên website đều có thể sử dụng thử miễn phí, Engnovate không hỗ trợ hoàn tiền.