Our system will evaluate the answer based on this AI-generated description.
The image contains two graphs; the top graph shows average daily temperatures in two Australian cities with data points for Brisbane maximum (Jan-29, Feb-29, Mar-28, Apr-26, May-23, Jun-21, Jul-21, Aug-22, Sep-24, Oct-26, Nov-27, Dec-29), Canberra maximum (Jan-28, Feb-27, Mar-25, Apr-20, May-16, Jun-12, Jul-11, Aug-13, Sep-16, Oct-19, Nov-23, Dec-26), Brisbane minimum (Jan-21, Feb-21, Mar-20, Apr-17, May-14, Jun-11, Jul-9, Aug-10, Sep-13, Oct-16, Nov-18, Dec-20), Canberra minimum (Jan-13, Feb-13, Mar-11, Apr-7, May-3, Jun-1, Jul-0, Aug-1, Sep-3, Oct-6, Nov-9, Dec-11). The bottom graph shows average number of days with rainfall in two Australian cities with bars representing Brisbane (Jan-11, Feb-12, Mar-14, Apr-11, May-9, Jun-6, Jul-5, Aug-5, Sep-5, Oct-8, Nov-9, Dec-11) and Canberra (Jan-9, Feb-9, Mar-9, Apr-6, May-7, Jun-7, Jul-6, Aug-7, Sep-7, Oct-8, Nov-8, Dec-7).
Given the complexity of the image, the above description may not be entirely accurate.
Skyrocket your IELTS band score by 1-2 points in under a month with our premium plan!
Note: Both the topic and the answer were created by one of our users.
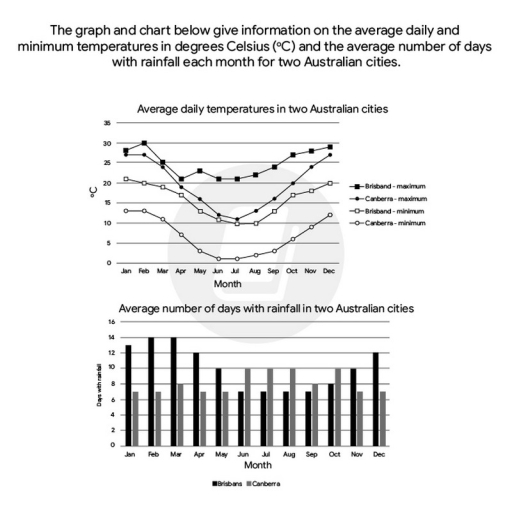
The graph and chart provide information on the average daily temperatures in degree Celious and the average number of rainy days per month for Brisbane and Canberra in Australia.
Overall, it is clear that the maximum and minimum temperatures in Brisnae were higher than those in Canberra in general. Additionally, while both cities had similar temperature trends, with the cooler weather occurring from April to September, the rainfall trends were opposite.
Looking at the graph in more detail, in Brisbane, the hottest daily temperature occurs in February, reaching 30°C. Whereas, Canberra’s maximum temperature was seen between December and February, approximately 27°C. And the lowest temperatures in both cities happen in July, dropping around 10°C in Brisbane and over 1°C in Canberra.
Meanwhile, the rainy days in Brisbane increased from December to April, with the highest figures occurring in February and March at 14 days with rainfall per month. In contrast, Canberra experienced the opposite trend; its rainiest month came from June to August, at an average of 10 rainy days per month.
Word Count: 172