Our system will evaluate the answer based on this AI-generated description.
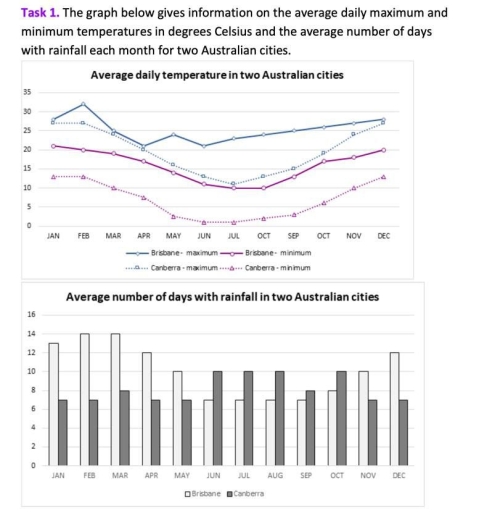
The image contains two graphs. Graph 1, "Average daily temperature in two Australian cities," shows temperatures in degrees Celsius from January to December. Brisbane maximum: Jan 30, Feb 29, Mar 28, Apr 26, May 23, Jun 21, Jul 21, Aug 22, Sep 25, Oct 27, Nov 29, Dec 31. Brisbane minimum: Jan 20, Feb 20, Mar 19, Apr 16, May 12, Jun 10, Jul 9, Aug 10, Sep 13, Oct 16, Nov 18, Dec 19. Canberra maximum: Jan 28, Feb 27, Mar 24, Apr 20, May 16, Jun 13, Jul 12, Aug 14, Sep 17, Oct 20, Nov 24, Dec 27. Canberra minimum: Jan 13, Feb 13, Mar 11, Apr 7, May 4, Jun 1, Jul 0, Aug 1, Sep 4, Oct 7, Nov 10, Dec 12. Graph 2, "Average number of days with rainfall in two Australian cities," shows monthly data: Brisbane: Jan 14, Feb 13, Mar 15, Apr 13, May 12, Jun 11, Jul 8, Aug 8, Sep 8, Oct 11, Nov 12, Dec 13. Canberra: Jan 9, Feb 8, Mar 9, Apr 8, May 9, Jun 10, Jul 10, Aug 11, Sep 8, Oct 8, Nov 9, Dec 9.
Given the complexity of the image, the above description may not be entirely accurate.
Skyrocket your IELTS band score by 1-2 points in under a month with our premium plan!
Note: Both the topic and the answer were created by one of our users.
The graph illustrates the moderate maximum and minimum temperatures recorded every day in degrees Celsius and the chart gives information on the quantity of rainfall monthly of two different countries in Australia,particularly in Brisband and Canberra.
Most strikingly,it is clear that the minimum average in Canberra experienced a downward trend,opposite the maximun temperature in Brisband during the observed time frame.In addition,the amount of rainfall stayed unchanged from June to August.
As can be seen from the graph of daily temperatures,the most prevalent category is the maximum in Brisband,which rises to 28 Celsius in January,reaching 30 Celsius in both february and december.In contrast,the maximum mediocre in Canberra commenced at 27 Celsius occur from December to February.The lowest average daily minimum temperature in both cities appear in July,declining to around 10 Celsius in Brisbane and 1 Celsius in Canberra
Meanwhile,from the bar chart there is a great amount of rainfall between December and April,with the highest figures occurring in February and March.On the other hand,in Canberra shrink consistently at average of 10 days with rainfall per month from June to August.
Word Count: 179
