Our system will evaluate the answer based on this AI-generated description.
The image contains a line graph comparing visits to 'Music Choice' and 'Pop Parade' over 15 days; day 1, 'Music Choice' had 40 visits and 'Pop Parade' had 120 visits; day 2, 'Music Choice' rose to 100 visits, 'Pop Parade' dropped to 80 visits; day 3, 'Music Choice' dropped to 20 visits, 'Pop Parade' rose to 140 visits; day 4, 'Music Choice' rose to 120 visits, 'Pop Parade' dropped to 100 visits; day 5, 'Music Choice' dropped to 60 visits, 'Pop Parade' rose to 160 visits; day 6, 'Music Choice' rose to 140 visits, 'Pop Parade' dropped to 120 visits; day 7, 'Music Choice' dropped to 20 visits, 'Pop Parade' rose to 180 visits; day 8, 'Music Choice' rose to 100 visits, 'Pop Parade' dropped to 20 visits; day 9, 'Music Choice' dropped to 60 visits, 'Pop Parade' rose to 160 visits; day 10, 'Music Choice' rose to 160 visits, 'Pop Parade' dropped to 60 visits; day 11, 'Music Choice' dropped to 20 visits, 'Pop Parade' rose to 180 visits; day 12, 'Music Choice' rose to 100 visits, 'Pop Parade' dropped to 60 visits; day 13, 'Music Choice' dropped to 60 visits, 'Pop Parade' rose to 140 visits; day 14, 'Music Choice' rose to 140 visits, 'Pop Parade' dropped to 100 visits; day 15, 'Music Choice' dropped to 40 visits, 'Pop Parade' rose to 160 visits; y-axis scale is in increments of 20 from 0 to 180, labeled '000s'; x-axis labeled 'Days' from 1 to 15; 'Music Choice' represented by dashed line, 'Pop Parade' represented by dotted line.
Given the complexity of the image, the above description may not be entirely accurate.
Skyrocket your IELTS band score by 1-2 points in under a month with our premium plan!
Note: Both the topic and the answer were created by one of our users.
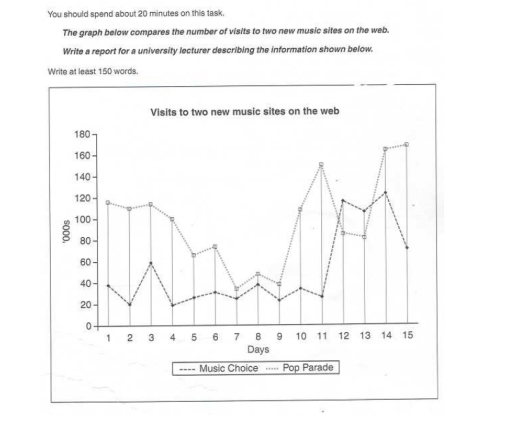
The line graph compares the number of attendances between two recent music websites. Overall, music lovers visited the Pop Parade site more often than the Music Choice site.
On the first day, 120,000 people visited the Pop Parade site. This number remained relatively stable for four days, after which attendance gradually declined to 70,000 visitors. For the next five days, the number of visitors stayed below 80,000 until the 10th day, when the figure shot up to 110,000. It then rose higher than 130,000. Unfortunately, two days later, the numbers fell to 80,000 visitors, which remained steady for two days. However, on the 14th day, the graph showed significant growth, ranging from 16,000 to 18,000 visitors.
The Music Choice site showed unstable attendance. On the third day, the number of visitors grew to 60,000, but then declined. For the next eight days, the numbers remained low. After that, attendance increased dramatically to 120,000 people. However, two days later, the percentage of attendance declined to 70,000 visitors.
Word Count: 166
