Our system will evaluate the answer based on this AI-generated description.
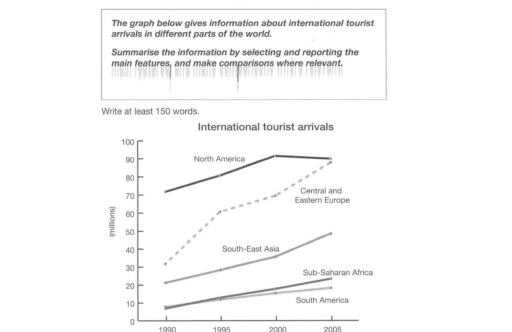
The image presents international tourist arrivals across various regions from 1990 to 2005, in millions. North America starts at approximately 70 million in 1990, stays flat around 80 million between 1995 and 2000, and ends slightly below 90 million in 2005. Central and Eastern Europe have about 30 million arrivals in 1990, reaching nearly 40 million by 1995, increasing to around 70 million by 2005. South-East Asia begins with fewer than 10 million in 1990, rising to around 20 million by 1995, approximately 27 million by 2000, and closes just above 30 million in 2005. Sub-Saharan Africa starts at slightly above 1 million in 1990, climbs to about 5 million by 1995, around 10 million by 2000, peaking marginally above 10 million in 2005. South America begins with less than 10 million in 1990, reaching about 10 million by 1995, approaching about 15 million in 2000, and finishes slightly above 15 million in 2005.
Given the complexity of the image, the above description may not be entirely accurate.
Skyrocket your IELTS band score by 1-2 points in under a month with our premium plan!
Note: Both the topic and the answer were created by one of our users.
The line graph provides information on number of tourist that arrived in various areas of the world.
Overall, it is clear that the number of tourists of all countries show an upward trend with different levels of increase. North America ranked first throughout the period, while Central and eastern Europe witnessed the highest increase in term of arrivals. Sub-sabaran Africa and South America were areas with lower numbers of visits, which changed their ranks by the end of the period.
In 1990, 70 mln visitors arrived to North America, this number increased steadily to about 90 million. Despite the decline to about 85 million, it experienced last 5 years, it had been the highest by the end of the period. Starting with 30 million, the nimber of people who visited Central and Eastern Europe rose gradually to about 84 million, just a little bit lower than former area.
Sub-saharan Africa and South America had the lowest number of visitors, stood at approximately 7 and 8 million, respectively. Both figures showed an increase, with former, which surpassed the later, at 20 million, while the later reached 18 million. South East Asia had 30 million visitors, a steady increase to 50 million was shown by this figure.
Word Count: 205
