🔥 Today Only: Save 30% on Premium — Offer Ends Soon! - Upgrade Now!
Line Graph

Band 5+: The graph below gives information about international tourist arrival in different parts of the world. Summarize the information by selecting and reporting the main features, and make comparisons where relevant.

Image for topic: The graph below gives information about international tourist arrival in different parts of the world. Summarize the information by selecting and reporting the main features, and make comparisons where relevant.
Our system will evaluate the answer based on this AI-generated description.
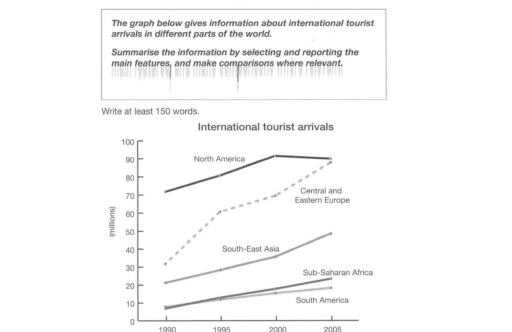
The image presents international tourist arrivals across various regions from 1990 to 2005, in millions. North America starts at approximately 70 million in 1990, stays flat around 80 million between 1995 and 2000, and ends slightly below 90 million in 2005. Central and Eastern Europe have about 30 million arrivals in 1990, reaching nearly 40 million by 1995, increasing to around 70 million by 2005. South-East Asia begins with fewer than 10 million in 1990, rising to around 20 million by 1995, approximately 27 million by 2000, and closes just above 30 million in 2005. Sub-Saharan Africa starts at slightly above 1 million in 1990, climbs to about 5 million by 1995, around 10 million by 2000, peaking marginally above 10 million in 2005. South America begins with less than 10 million in 1990, reaching about 10 million by 1995, approaching about 15 million in 2000, and finishes slightly above 15 million in 2005.
Given the complexity of the image, the above description may not be entirely accurate.
Note: Both the topic and the answer were created by one of our users.

The line graph shows tourist arrivals in different countries. Overall, the figures for all the countries saw an upward trend, with North America and Central and Eastern Europe becoming the leaders at the end. Of particular note, South America lagged significantly in all the years.

Focusing on larger figures, North America started out the highest level of tourists; 70 millinons in 1990. Then this amount experienced gradual increase untill around 92 million visitors in 2000, when it saw almost no change next 5 years. The Europe, a continent that started out at 30 million in yearliest times, increased sharply over the period to 90 million, registering the largest chage in the graph. At the end, these two places recorded the same results; 90 million tourists, becoming dominating amounts.

Parts of other countries at lower points were rising slightly in all the years: South-Eastern Asia from 20 to 50 millions. Africa and South America, in particular, begun with 10 millions, after which Africa reached 20 millions and South America 18 millions.

Word Count: 170

Answers On The Same Topic:

The graph below gives information about international tourist arrival in different parts of the world. Summarize the information by selecting and reporting the main features, and make comparisons where relevant.

The line graph shows the number of international tourist arriving in five different parts of the globe between 1990 and 2005. Overall, it is clear that all categories showed and upward trend throughout the fifteen year-period, with South-East Asia undergoing the sharpest increase and South-America the lowest growth. Turning first to North America arrivals, this […]

The graph below gives information about international tourist arrival in different parts of the world. Summarize the information by selecting and reporting the main features, and make comparisons where relevant.

The line graph compares the number of international tourist arrivals, in millions, in five distinct regions in the world, from 1990 to 2005. Overall, all five areas witnessed an upward trend in the influx of travellers throughout the entire period. Additionally, North America was the most prevalent place to visit in the given time frame. […]

The graph below gives information about international tourist arrival in different parts of the world. Summarize the information by selecting and reporting the main features, and make comparisons where relevant.

The line graph compares the number of international tourist arrivals, in millions, in five distinct regions in the world, from 1990 to 2005. Overall, all five areas witnessed an upward trend in the influx of travellers throughout the entire period. Additionally, North America was the most prevalent place to visit in the given time frame. […]

The graph below gives information about international tourist arrival in different parts of the world. Summarize the information by selecting and reporting the main features, and make comparisons where relevant.

The line graph provides information on number of tourist that arrived in various areas of the world. Overall, it is clear that the number of tourists of all countries show an upward trend with different levels of increase. North America ranked first throughout the period, while Central and eastern Europe witnessed the highest increase in […]

See All

Other Topics:

the graph shows how londeners commute to work. Describe it

The line graph provides information about how people of London commute to work by utilizing distinct types of transport forms between 1970 and 2010. Overall, use of bus and car observed substantial decrease at its numbers, while subway followed an opposite trend. Similarly, to subway both bicycle and walking to the work rise modestly over […]

The line graph shows the percentage ofdifferent age groups ofcinema visitors in a particular country from 1978 to 2008.

The line graph provides information about the ratio of different age classifications of cinema watchers in a specific country between 1978 and 2008. The figures expressed in percentage. Overall, cinema movies were most popular among ages 14-24, whereas the age group above 50 were likely to visit cinemas. In detail, a fluctuation pattern can be […]

The graph below shows the number of students studying Computer Science at a university from 2010 to 2020.

The line graph illustrates the number of students who studied computer science at a university between 2010 and 2020. Overall it is clearly seen that, the number of computer science students increased over the period. Although there was a slight decline in 2016, the figure then rose sharply and reached its highest point in 2020. […]

The graph below gives information about the percentage of the population in four Asian countries living in c/tles from 1970 to 2020, with predictions for 2030 and 2040. Summarise the information by selecting and reporting the main features, and make comparisons where relevant.

The followig line chart illustrates the growth of indvisuals living in asian cites through 1970 to 2020, as well as, prections for the upcoming 20 years. As showen in the graph through out the years all populations in all of the Four cites climbed, but the highest being Indonesia and Malaysia( at about 60% and […]

The graph shows the number of international tourists visiting four European countries (Spain, France, Italy, and Greece) from 2010 to 2020.

The line graph illustrates the number of international tourists visiting four European countries – Spain, France, Italy and Greece – between 2010 and 2020. Overall, Spain and France had the highest numbers of tourists throughout most of the period, while Greece had the lowest figures. All four countries experienced significant growth between 2010 and 2018, […]

The line graph shows the number of first time visitors and returning visitors who visited Caryl Island from 2000 to 2008.

The line graph illustrates changes in the number of people travelling to a Caryl island between 2000 and 2008, separating those who travelled for the first-time from those who visited for the second time. Overall, it is evident that the figures for both types of travelers increased markedly across the period. Although returning visitors accounted […]

See All
We have detected unusual activity on your device.
Please verify your identity to continue.
Note: This verification step won't sign you in. If you have a premium account, please log in to access the service as usual.
Google/Gmail Verification
Or verify using Email/Code
We've sent a verification code to:
youremail@gmail.com (Not your email?)
Enter it below to complete the verification process.
Ensure your email address is correct, your inbox is not full, and you check your spam folder. If no email arrives, consider using an alternative email.
You will need a Premium plan to perform your action!
Note: If you already have a premium account, please log in to access our services as usual.

Plans & Pricing

Our mission is to make quality education accessible for everyone.
However, to keep our hardworking team running and this service alive, we genuinely need your support!
By opting for a premium plan, not only do you sustain us in achieving the mission, but you also unlock advanced features to enrich your learning experience.

Free

For learners who aren't pressed for time

What's included on Free
100+ Cambridge IELTS Tests
Instant IELTS Writing Task 1 & 2 Evaluation (2 times/month)
Instant IELTS Speaking Part 1, 2, & 3 Evaluation (2 times/month)
Instant IELTS Writing Task 1 & 2 Essay Generator (2 times/month)
500+ Dictation & Shadowing Exercises
100+ Pronunciation Exercises
Flashcards
Other Advanced Tools

Premium

For those serious about advancing their English proficiency, and for IELTS candidates aspiring to boost their band score by 1-2 points (especially in writing & speaking) in just 30 days or less

What's included on Premium
Save Your IELTS Test Progress & Analyze Mistakes By Question Type
Save Your Own Flashcard Sets & Use Them On Any Device
Unlock All Courses, IELTS Tests, Section & Part Practice
Unlimited AI Conversations
Unlimited AI Writing Enhancement Exercises
Unlimited IELTS Writing Task 1 & 2 Evaluation
Unlimited IELTS Speaking Part 1, 2, & 3 Evaluation
Checked Answers Will Not Be Published
Unlimited IELTS Writing Task 1 & 2 Essay Generator
Unlimited IELTS Speaking Part 1, 2, & 3 Sample Generator
Unlimited Usage Of Advanced Tools & AI Features
Priority Support within 24h (12-month plan only)

Due to the nature of our service and the provided free trials, payments are non-refundable.