Our system will evaluate the answer based on this AI-generated description.
The image contains a line graph depicting the number of households, in thousands, using satellite, cable, internet, or broadcast technology for watching television in a US city from 2004-2014. Satellite usage started at just over 40,000 households in 2004, steadily increased to peak at just below 120,000 in 2008, and declined to below 100,000 by 2014. Cable began as the most popular method with over 120,000 households in 2004, fluctuated slightly, but maintained a general decline to just above 60,000 by 2014. Internet usage showed a gradual incline from about 20,000 households in 2004 to just below 80,000 in 2014. Broadcast technology started at just under 60,000 households in 2004, experienced a decline until 2010, and increased to nearly 70,000 by 2014. Cable was consistently the most used technology until 2010 when it was surpassed by satellite; however, by 2014, satellite again fell below cable usage. Broadcast remained the least used technology from 2004-2008, after which internet usage dropped below it until 2010.
Given the complexity of the image, the above description may not be entirely accurate.
Skyrocket your IELTS band score by 1-2 points in under a month with our premium plan!
Note: Both the topic and the answer were created by one of our users.
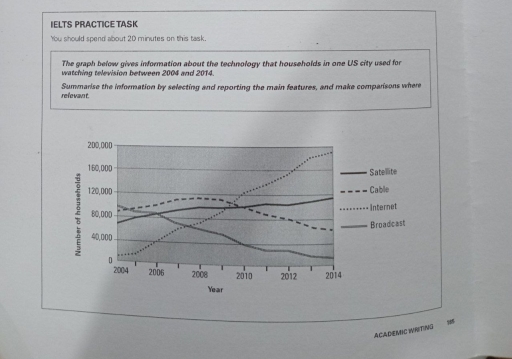
The line graph represents information about the consumption of four different types of technologies – satellite, cable, internet, and broadcast – by U.S. families from 2004 to 2014.
Overall, internet usage experienced significant growth during this period, while cable, broadcast, and satellite services saw a decline.
In 2004, broadcast was the most widely used technology, with approximately 100,000 households subscribing. It was followed by cable and satellite, which had around 80,000 households each, while internet usage was only at 20,000. However, over the following decade, internet users increased rapidly, surpassing all other technologies by 2010. By 2014, internet usage peaked at nearly 200,000 households.
Additionally, the usage of broadcast technology decreased by 20,000 households over the period. In contrast, satellite usage remained stable, rising from 70,000 to 120,000 households by the end of the decade. Furthermore, cable started to decline in 2010, and by 2014, it accounted for only 60,000 households.
Word Count: 151