Our system will evaluate the answer based on this AI-generated description.
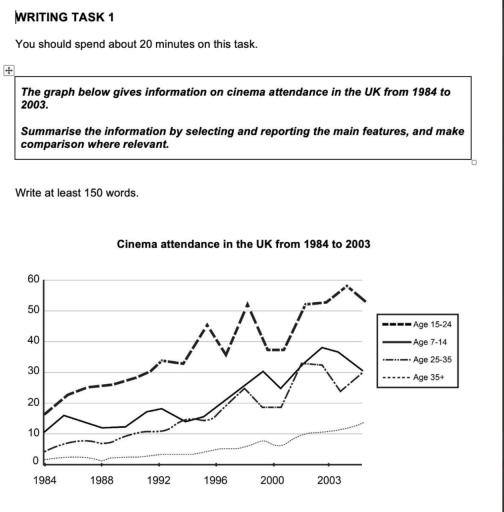
The image displays a line graph, 'Cinema attendance in the UK from 1984 to 2003', showing data for four age groups across a vertical axis from 0 to 60. For the Age 15-24 group, the approximate yearly values are: 16 (1984), 22 (1985), 24 (1986), 25 (1987), 26 (1988), 28 (1989), 29 (1990), 32 (1991), 33 (1992), 32 (1993), 40 (1994), 45 (1995), 35 (1996), 46 (1997), 52 (1998), 40 (1999), 38 (2000), 45 (2001), 52 (2002), and 57 (2003). For the Age 7-14 group, the approximate values are: 10 (1984), 16 (1985), 15 (1986), 12 (1987), 12 (1988), 11 (1989), 17 (1990), 18 (1991), 12 (1992), 12 (1993), 15 (1994), 15 (1995), 20 (1996), 25 (1997), 27 (1998), 30 (1999), 25 (2000), 32 (2001), 38 (2002), and 30 (2003). For the Age 25-35 group, the values are approximately: 7 (1984), 5 (1985), 6 (1986), 8 (1987), 7 (1988), 7 (1989), 9 (1990), 11 (1991), 18 (1992), 12 (1993), 13 (1994), 13 (1995), 15 (1996), 22 (1997), 26 (1998), 18 (1999), 19 (2000), 30 (2001), 32 (2002), and 22 (2003). For the Age 35+ group, the approximate values are: 3 (1984), 1 (1985), 1 (1986), 2 (1987), 0 (1988), 1 (1989), 2 (1990), 2 (1991), 3 (1992), 2 (1993), 3 (1994), 4 (1995), 4 (1996), 5 (1997), 4 (1998), 8 (1999), 6 (2000), 8 (2001), 10 (2002), and 13 (2003).
Given the complexity of the image, the above description may not be entirely accurate.
Skyrocket your IELTS band score by 1-2 points in under a month with our premium plan!
Note: Both the topic and the answer were created by one of our users.
The line graph illustrates changes in cinema attendance among four age groups in the UK between 1984 and 2003.
Overall, cinema attendance increased across all age categories over the period. People aged 15-24 consistently recorded the highest participation and experienced the most substantial growth, whereas those aged 35 and over remained the least frequent cinema-goers despite a gradual rise.
Attendance among individuals aged 15-24 showed a strong upward trend, climbing from about 18% in 1984 to just over 50% by 2003, although the figure fluctuated noticeably during the mid-to-late 1990s. Similarly, the 7-14 age group witnessed significant growth. Starting at approximately 10%, attendance rose steadily overall and peaked at around 35% in the early 2000s before declining slightly at the end of the period.
By contrast, older age groups recorded lower and more moderate increases. Cinema attendance among those aged 25-35 rose unevenly from roughly 5% in 1984 to about 20% by 2003, following several fluctuations. Meanwhile, the 35+ group experienced the slowest growth, increasing gradually from near zero to approximately 13%, and remained the smallest proportion throughout the timeframe.
Word Count: 180
