Our system will evaluate the answer based on this AI-generated description.
The image displays a line graph, 'Cinema attendance in the UK from 1984 to 2003', showing data for four age groups across a vertical axis from 0 to 60. For the Age 15-24 group, the approximate yearly values are: 16 (1984), 22 (1985), 24 (1986), 25 (1987), 26 (1988), 28 (1989), 29 (1990), 32 (1991), 33 (1992), 32 (1993), 40 (1994), 45 (1995), 35 (1996), 46 (1997), 52 (1998), 40 (1999), 38 (2000), 45 (2001), 52 (2002), and 57 (2003). For the Age 7-14 group, the approximate values are: 10 (1984), 16 (1985), 15 (1986), 12 (1987), 12 (1988), 11 (1989), 17 (1990), 18 (1991), 12 (1992), 12 (1993), 15 (1994), 15 (1995), 20 (1996), 25 (1997), 27 (1998), 30 (1999), 25 (2000), 32 (2001), 38 (2002), and 30 (2003). For the Age 25-35 group, the values are approximately: 7 (1984), 5 (1985), 6 (1986), 8 (1987), 7 (1988), 7 (1989), 9 (1990), 11 (1991), 18 (1992), 12 (1993), 13 (1994), 13 (1995), 15 (1996), 22 (1997), 26 (1998), 18 (1999), 19 (2000), 30 (2001), 32 (2002), and 22 (2003). For the Age 35+ group, the approximate values are: 3 (1984), 1 (1985), 1 (1986), 2 (1987), 0 (1988), 1 (1989), 2 (1990), 2 (1991), 3 (1992), 2 (1993), 3 (1994), 4 (1995), 4 (1996), 5 (1997), 4 (1998), 8 (1999), 6 (2000), 8 (2001), 10 (2002), and 13 (2003).
Given the complexity of the image, the above description may not be entirely accurate.
Skyrocket your IELTS band score by 1-2 points in under a month with our premium plan!
Note: Both the topic and the answer were created by one of our users.
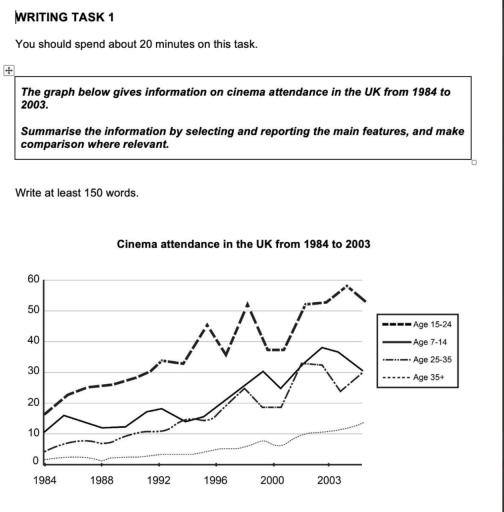
The line graph shows information about four age collective who attended to the cinema in 1984 and 2003.
Overall, it is clear that all four age categories saw an significant increase to going cinema over the period, mostly, middle age group always had highest attendance among others.
In 1984, people who aged 15-24 recorded the highest attendance rate, starting at approximately 19% , a figure that then rose almost 35% by next year. At around 1997 hitted the peak for over 50%. Then at the end in 2003 accounted around 52%. Meanwhile, figure that showed the lowest participation by people aged over 35, this group almost stood at around 0% in 1992. Then year by year growed to approximately 10%
in 2003.
Looking at the figures aged 25-35 and 7-14, which showed simillar upward trends by the period. First in 1984 figures were around 10% . A figures that then jumped to 30% in 2003, with significantly fluctuations in 2000
Word Count: 160