Our system will evaluate the answer based on this AI-generated description.
The image displays a line graph, 'Cinema attendance in the UK from 1984 to 2003', showing data for four age groups across a vertical axis from 0 to 60. For the Age 15-24 group, the approximate yearly values are: 16 (1984), 22 (1985), 24 (1986), 25 (1987), 26 (1988), 28 (1989), 29 (1990), 32 (1991), 33 (1992), 32 (1993), 40 (1994), 45 (1995), 35 (1996), 46 (1997), 52 (1998), 40 (1999), 38 (2000), 45 (2001), 52 (2002), and 57 (2003). For the Age 7-14 group, the approximate values are: 10 (1984), 16 (1985), 15 (1986), 12 (1987), 12 (1988), 11 (1989), 17 (1990), 18 (1991), 12 (1992), 12 (1993), 15 (1994), 15 (1995), 20 (1996), 25 (1997), 27 (1998), 30 (1999), 25 (2000), 32 (2001), 38 (2002), and 30 (2003). For the Age 25-35 group, the values are approximately: 7 (1984), 5 (1985), 6 (1986), 8 (1987), 7 (1988), 7 (1989), 9 (1990), 11 (1991), 18 (1992), 12 (1993), 13 (1994), 13 (1995), 15 (1996), 22 (1997), 26 (1998), 18 (1999), 19 (2000), 30 (2001), 32 (2002), and 22 (2003). For the Age 35+ group, the approximate values are: 3 (1984), 1 (1985), 1 (1986), 2 (1987), 0 (1988), 1 (1989), 2 (1990), 2 (1991), 3 (1992), 2 (1993), 3 (1994), 4 (1995), 4 (1996), 5 (1997), 4 (1998), 8 (1999), 6 (2000), 8 (2001), 10 (2002), and 13 (2003).
Given the complexity of the image, the above description may not be entirely accurate.
Skyrocket your IELTS band score by 1-2 points in under a month with our premium plan!
Note: Both the topic and the answer were created by one of our users.
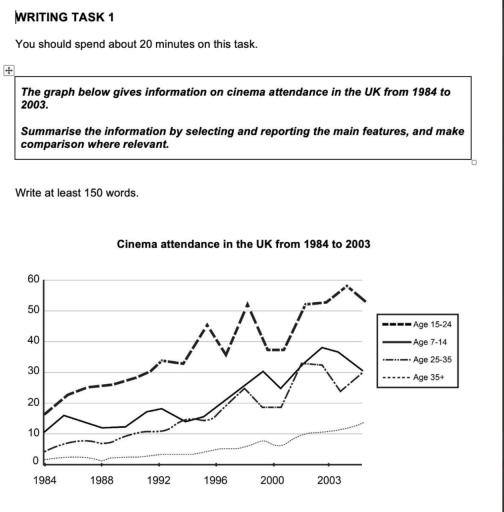
The line chart compares trends in cinema attendance among four different age groups across the UK between 1984 and 2003.
Overall, it is immediately noticeable that all age groups experienced increases, albeit to varying degrees. Age group of 15-24 was the most pronounced category, by contrast, the 35+ group remained significantly stable despite a marked growth throughout the period.
Turning to the youngsters, cinema attendance among those aged between 15 and 24 saw a generally upward trend despite some fluctuation. Starting at approximately 18% in 1984, which then followed by a steady rise to around 30% by the early 1990s, before experimenting dramatic variations, which finished the period by just above 50%. Conversely, attendance who aged 7-14% increased dramatically. Beginning at precisely 10% in 1984, prior to reaching the apex with about 35% at the end, the figure fluctuated modestly during the late 1980s.
In terms of old viewers, cinema attendance within 25-35 age group rose remarkably over the period. Having experienced an erratic behavior from 1984 to 2000, the figure ultimately reached its final by at roughly 20%. Notwithstanding this increase, the 35+ age group stayed the least frequent cinema-goers by the end of the period.
Word Count: 197