Our system will evaluate the answer based on this AI-generated description.
The image presents a line graph with two series depicting the "Percentage of first-year teachers with regular teaching jobs by year of graduation," specifically for English-language teachers and French-language teachers. The x-axis lists the years of graduation from 2001 to 2007, and the y-axis represents the percentage scale from 30% to 80% in increments of 10%. English-language teachers' data points are as follows: 2001 - 70%, 2002 - 68%, 2003 - 54%, 2004 - 42%, 2005 - 38%, 2006 - 40%, and 2007 - 38%. French-language teachers' data points are: 2001 - 76%, 2002 - 74%, 2003 - 70%, 2004 - 60%, 2005 - 48%, 2006 - 50%, and 2007 - 52%. The graph shows an overall decline in the percentage of first-year teachers with regular teaching jobs for both English-language and French-language teachers over the seven-year span, with French-language teachers consistently having a higher percentage compared to English-language teachers each year.
Given the complexity of the image, the above description may not be entirely accurate.
Skyrocket your IELTS band score by 1-2 points in under a month with our premium plan!
Note: Both the topic and the answer were created by one of our users.
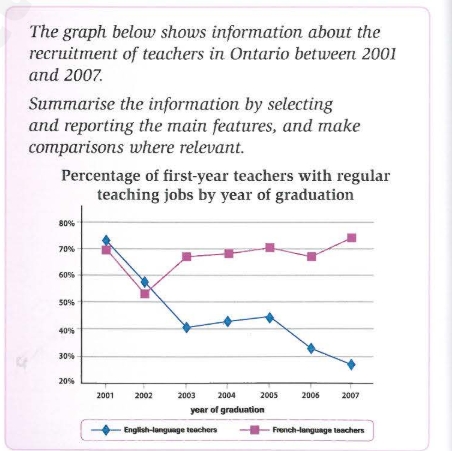
The line graph illustrates the data, in percentage, of the enrollment of freshman teachers majoring in either English or French in Ontario. The information provided covers the years 2001 through 2007.
In general, it can be seen that tutors who teach French were more likely to be employed, whereas the recruitment of the other group decreased throughout this time.
In 2001, the figure for teachers whose specialty is French was 70%, compared to around 72% of those who teach English.
Over the next two years, the employment of French language instructors experienced a rapid fall, from 70% to more or less 52%, but then increased by 17% thereafter. As for the proportion of English teachers, it witnessed a significant shrink of 40%.
Looking at the period from 2004 to 2007, the former remained stable until 2006 and then recovered a peak at 75%. On the other hand, there was a slight rise in the latter before it bottomed out at approximately 28%. That was 2.5 times lower than the value of the other.
Word Count: 173
