Our system will evaluate the answer based on this AI-generated description.
The image presents a line graph depicting the average monthly change in prices of copper, nickel, and zinc for the year 2014, measured as percentage change in price compared to previous month. Copper starts at approximately -3.5% in January, peaks at approximately 5% in July, and ends at approximately 0% in December. Nickel starts at approximately -2% in January, peaks at approximately 6.5% in May, and ends at approximately -1.5% in December. Zinc starts at approximately -1.5% in January, peaks at approximately 3.5% in July, and ends at approximately -2% in December. Copper shows a consistent increase from January to July, followed by fluctuations and a decrease towards the end of the year. Nickel shows a sharp increase from April to May, followed by fluctuations with a general downward trend. Zinc shows moderate increases and decreases throughout the year with no clear overall trend. Each data point is marked by a symbol representing the respective metal, with a key provided at the bottom of the graph.
Given the complexity of the image, the above description may not be entirely accurate.
Skyrocket your IELTS band score by 1-2 points in under a month with our premium plan!
Note: Both the topic and the answer were created by one of our users.
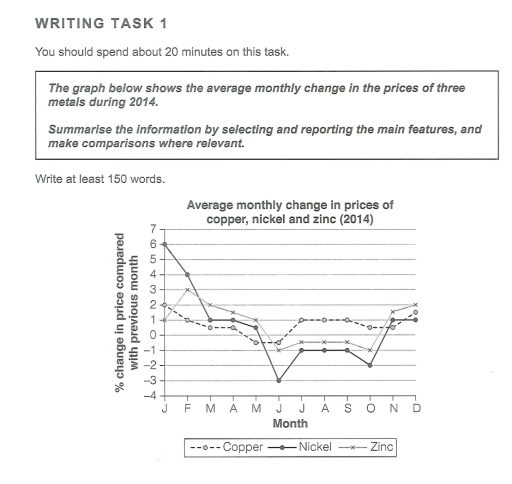
The following line diagram presents the information on the prices of three minerals every month. Overall, the data relates to the period of 2014 year and illustrate the changes in the costs of copper, nickel and zinc.
It can be clearly seen that in January nickel had the biggest gap in price (6%) through the year. Moreover, nickel also take the lowest percentage of -3 in June. That all shows that over the whole year, the price of nickel has experienced the biggest variety among other metals. The copper was closely for the same money in 2014, and by the end of the year, the difference was only 0,5 percent.
It is worth noting that from march to May all costs were constantly decreasing, furthermore, in July, August, and September values were unchanged at all. In December three figures turned out to be approximately similar in the range from 1% (nickel), to 1,5% (copper), and to 2% (zinc).
Word Count: 158
