Our system will evaluate the answer based on this AI-generated description.
The image presents a line graph depicting the average monthly change in prices of copper, nickel, and zinc for the year 2014, measured as percentage change in price compared to previous month. Copper starts at approximately -3.5% in January, peaks at approximately 5% in July, and ends at approximately 0% in December. Nickel starts at approximately -2% in January, peaks at approximately 6.5% in May, and ends at approximately -1.5% in December. Zinc starts at approximately -1.5% in January, peaks at approximately 3.5% in July, and ends at approximately -2% in December. Copper shows a consistent increase from January to July, followed by fluctuations and a decrease towards the end of the year. Nickel shows a sharp increase from April to May, followed by fluctuations with a general downward trend. Zinc shows moderate increases and decreases throughout the year with no clear overall trend. Each data point is marked by a symbol representing the respective metal, with a key provided at the bottom of the graph.
Given the complexity of the image, the above description may not be entirely accurate.
Skyrocket your IELTS band score by 1-2 points in under a month with our premium plan!
Note: Both the topic and the answer were created by one of our users.
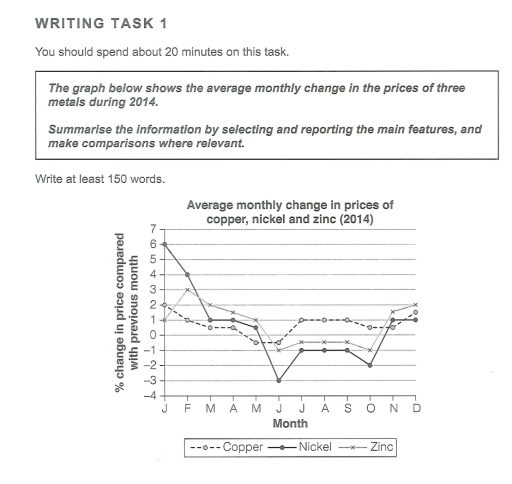
The line chart represents the average change in prices monthly for 3 types of metals over the year 2014.
Overall, there were more drastic differences in prices between January to June, compared to July to December. Most notable example being Nickel.
Looking at the first half of the year, Nickel started at 6%, the highest point in the chart, then quickly plummeted down to 1%. After 2 months of stability, its price slid down again, hitting the bottom at -3%. Similarly, Copper also witnessed a price drop in this time period, albeit slower, from 2% to -0.5% in six months. The price of Zinc initially increased 2%, from 1%, but quickly went down to -1% from February to June.
Moving onto the latter half, all three metals shared a somewhat identical pattern. Their prices improved moderately in July, with Copper reaching a positive number of 1%, and remained stable until September before dropping slightly in October. November saw a price hike in both Nickel and Zinc, from -2% and -1% up to 1% and 1.5% respectively. In the last month, only Copper and Zinc prices climbed incrementally while that of Nickel stayed unchanged.
Word Count: 193
