Our system will evaluate the answer based on this AI-generated description.
The image depicts a bar graph representing the contribution of selected sectors to the UK economy in the twentieth century, with data points in 1900, 1950, 1975, and 2000. The graph shows three sectors: Agriculture (in blue), Manufacturing (in green), and Business and Financial (in purple). In 1900, Agriculture contributed approximately 10%, Manufacturing 50%, and Business and Financial 40%. In 1950, the contributions were approximately 5% for Agriculture, 45% for Manufacturing, and 50% for Business and Financial. By 1975, Agriculture's contribution decreased to around 2%, while Manufacturing and Business and Financial had contributions of roughly 35% and 63% respectively. In 2000, Agriculture's contribution was negligible at less than 5%, Manufacturing decreased further to around 25%, and Business and Financial increased to around 70%.
Given the complexity of the image, the above description may not be entirely accurate.
Skyrocket your IELTS band score by 1-2 points in under a month with our premium plan!
Note: Both the topic and the answer were created by one of our users.
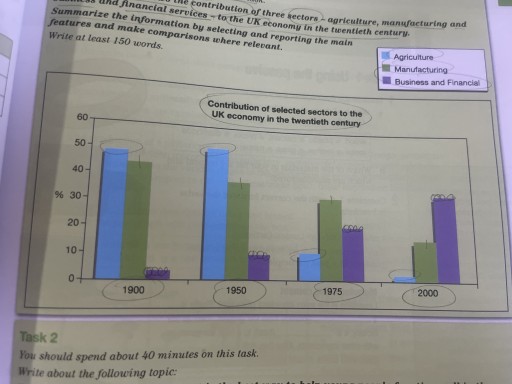
The bar graph illustrates the contribution of three groups to the UK economy in the twentieth century. It includes agriculture, manufacturing, and business and finance.
Overall, agriculture provided major and minor contributions to the UK economy during the examined time. In contrast, business and finance had an upward trend while manufacturing followed in a downward style. Meanwhile, agriculture fluctuated through the evaluation period.
In particular, the major and fewer showed by agriculture in 1950 and 2000 which around 50% and 1% respectively. By the way, other years contributions showed approximately 49% in 1900 and 1975 not as many in 1900 which approximately 10%. Futhermore, in 2000 business and finance were provided more contributions than 1900 which stood at 35%. And also, other years placed between around 10% to 25% respectively.
Moreover, manufacturing field higher contributions showed in 1900 which nearly 45% while fewer recorded around 15% in 2000. Additionally, other years switched their support in a similar range, which between 35% to 38% in twentieth century.
Word Count: 166