🔥 Today Only: Save 30% on Premium — Offer Ends Soon! - Upgrade Now!
Line Graph

Band 7+: the graph below shows the difference in wheat exports over three different areas. write a report for a university lecturer describing the information shown below. write at least 150 words.

Image for topic: the graph below shows the difference in wheat exports over three different areas. write a report for a university lecturer describing the information shown below. write at least 150 words.
Our system will evaluate the answer based on this AI-generated description.
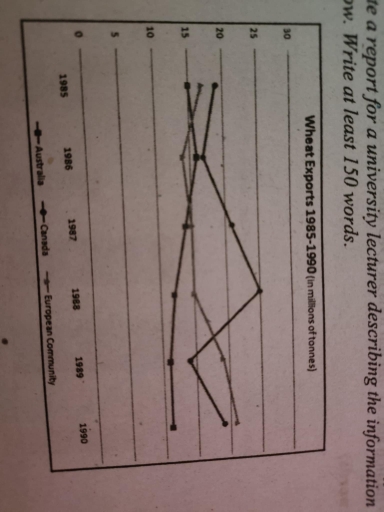
The image contains a graph depicting wheat exports (in millions of tonnes) from 1985-1990 for Australia, Canada, and the European Community. In 1985, Australia's exports were 15 million tonnes, Canada's were 19 million tonnes, and the European Community's were 13 million tonnes. In 1986, Australia's exports dropped to 11 million tonnes, Canada's fell to 17 million tonnes, and the European Community's slightly decreased to 12 million tonnes. In 1987, Australia exported 12 million tonnes, Canada 12 million tonnes, and the European Community 16 million tonnes. For 1988, Australia's exports rose sharply to 21 million tonnes, Canada's increased to 15 million tonnes, and the European Community's decreased slightly to 14 million tonnes. In 1989, Australia's exports were 18 million tonnes, Canada's slightly increased to 20 million tonnes, and the European Community peaked at 23 million tonnes. By 1990, Australia's exports increased to 22 million tonnes, Canada's dropped to 18 million tonnes, and the European Community's significantly fell to 12 million tonnes.
Given the complexity of the image, the above description may not be entirely accurate.
Note: Both the topic and the answer were created by one of our users.

The line graph compares three regions in terms of exports of wheat between 1985 and 1990.

Overall, the three regions experienced different trends in the time period. While the wheat export in Canada and European countries rose with some fluctuations, the export in Australia fell over time.

As the graph shows, Australia’s wheat export figure started at 15 million tons in 1985 followed by a small increase to around 16 million tons in 1986. Then, it declined steadily until it fell to just over 10 million tons in 1990. Regarding Canada’s exports, in 1985 they shipped approximately 19 million tons of wheat. This figure fell to about 17 million in 1986, but then their exports experienced considerable growth to 25 million tons in 1988. Afterward, the figure plunged to below 15 million in 1989, but then subsequently rose to just under 20 million in 1990.

By contrast, the wheat exports from the European Community experienced an increase in the six year period. In 1985, nearly 16 million tons were exported, but this number fell to about 14 million in 1986. Then, the exports increased to exactly 15 million tons in 1987 and 1988 before witnessing steady growth to 19 million and 21 million tons in 1989 and 1990, respectively.

Word Count: 209

Answers On The Same Topic:

the graph below shows the difference in wheat exports over three different areas. write a report for a university lecturer describing the information shown below. write at least 150 words.

The line graph compares three regions in terms of exports of wheat between 1985 and 1990. Overall, the three regions experienced different trends in the time period. While the two country canada and Europian communityrose with some fluctuation, Australia’s exports fell over time. As the graph shows, Australia’s export figure started 15 million tons of […]

the graph below shows the difference in wheat exports over three different areas. write a report for a university lecturer describing the information shown below. write at least 150 words.

The graph illustrate the difference between 3 territories that have wheat exports. The areas is: Australia, Canada, European Community. There are period from 1985 to 1990 years. Overall, this process consist the stages, beggining with 1985 and ending with 1990. There is a 3 countries, and the 2 of them have stable moving and the […]

the graph below shows the difference in wheat exports over three different areas. write a report for a university lecturer describing the information shown below. write at least 150 words.

The given line graph providea a breakdown of wheat export over the three areas. Overall, what stands out from the graph is that both Canada adn European Community saw a steady growth, while the Australia declined slighly. In the opening year, in 1985, European Community exported about 17 million tonnes of wheat, whereas Canada exported […]

the graph below shows the difference in wheat exports over three different areas. write a report for a university lecturer describing the information shown below. write at least 150 words.

The given line graph illustrates the disparities in Australia, Canada and European communitiy wheat exportation between 1985 and 1990. Overall, it is clear that all statics have an erratic trajectory. While Canada data dominated through most of the surveyed period, Australia number was at the other end. Regarding the amount of wheat Canada exported in […]

the graph below shows the difference in wheat exports over three different areas. write a report for a university lecturer describing the information shown below. write at least 150 words.

The chart illustrates the various wheat exports in three different areas in 1985 – 1990 (million tones) In an overview, it is evident that cannada had the highest peak of export of wheat in 1988 while Australia showed decrease towards 1990 In the case of Canada it showed a slight depth in 1986 then which […]

See All

Other Topics:

the line graph illustrates the proportion of total expenditure in a certain european country between 1960 and 2000

The line graph illustrates the percentage of expenditure on five categories in Europe, namely food, leisure, clothing, transport and energy, over a 40-year period from 1960 to 2000. Overall, expenditure on transport experienced an upward trend, while the other categories showed a downward trend. Food showed the most noticeable change over the period. In 1960, […]

The line graph below shows information on rice export from Thailand to other countries from 1995 to 2020. Summarize the information by selecting and reporting the main features, and make comparisons where relevant, Write at least 150 words

The given line graph depiets the proportion of rice export from Thailand to four countries: China, Japan, Korea and India, between 1995 and 2020. The units are measured in percentage. The main facts that stand out is that the proportion in China increased significantly and become the highest by the end of the period, whereas […]

The line graph below shows the average monthly expenditure (in dollars) of households in a country on three different types of food between 2010 and 2020. Summarise the information by selecting and reporting the main features, and make comparisons where relevant.

The line graph illustrates the average monthly household spending in dollars on three different categories of food, which are fruit and vegetables, meat and fish, and grains and cereals. Throughout the year, between 2010 and 2020. Overall, the most noticeable change was with meat and fish rose marginally, although was initally at lowest at the […]

The graph below shows radio and television audiences throughout the day in 1992. Summarise the information by selecting and reporting the main features, and make comparisons where relevant.

The graph illustrate the percentage of audiences in UK who watched TV and listened to the radio from October- December in 1992. Overall, radio was more popular in the morning, reaching the highest proportion at 8 o’clock. After that listening to the radio deceased gradually. Television viewing peaked in the evening between 6 p.m. and […]

Task 1: (Line Graph) Differing amount of nitrogen oxide by four types of vehicles.

The line graph illustrates the nitrogen oxide emissions generated by four distinct vehicles. Overall, it is clear that the nitrogen oxide emissions produced by buses moderately climb, while lorries’ nitrogen oxide emissions significantly decrease. It is also noticeable that petrol cars and diesel cars experience no change in their nitrogen oxide emissions. Regarding buses, the […]

The line chart below shows the percentage of households owning a car in four countries from 2000 to 2020.

The table illustrates the proportion of households that had a car in each country during 20 year-period between 2000 and 2020. It can clearly be seen that the percentage of households travelling by car had increased in each country; Germany demonstrates the biggest rates, whilst the population with the lowest car usage was in India […]

See All
We have detected unusual activity on your device.
Please verify your identity to continue.
Note: This verification step won't sign you in. If you have a premium account, please log in to access the service as usual.
Google/Gmail Verification
Or verify using Email/Code
We've sent a verification code to:
youremail@gmail.com (Not your email?)
Enter it below to complete the verification process.
Ensure your email address is correct, your inbox is not full, and you check your spam folder. If no email arrives, consider using an alternative email.
You will need a Premium plan to perform your action!
Note: If you already have a premium account, please log in to access our services as usual.

Plans & Pricing

Our mission is to make quality education accessible for everyone.
However, to keep our hardworking team running and this service alive, we genuinely need your support!
By opting for a premium plan, not only do you sustain us in achieving the mission, but you also unlock advanced features to enrich your learning experience.

Free

For learners who aren't pressed for time

What's included on Free
100+ Cambridge IELTS Tests
Instant IELTS Writing Task 1 & 2 Evaluation (2 times/month)
Instant IELTS Speaking Part 1, 2, & 3 Evaluation (2 times/month)
Instant IELTS Writing Task 1 & 2 Essay Generator (2 times/month)
500+ Dictation & Shadowing Exercises
100+ Pronunciation Exercises
Flashcards
Other Advanced Tools

Premium

For those serious about advancing their English proficiency, and for IELTS candidates aspiring to boost their band score by 1-2 points (especially in writing & speaking) in just 30 days or less

What's included on Premium
Save Your IELTS Test Progress & Analyze Mistakes By Question Type
Save Your Own Flashcard Sets & Use Them On Any Device
Unlock All Courses, IELTS Tests, Section & Part Practice
Unlimited AI Conversations
Unlimited AI Writing Enhancement Exercises
Unlimited IELTS Writing Task 1 & 2 Evaluation
Unlimited IELTS Speaking Part 1, 2, & 3 Evaluation
Checked Answers Will Not Be Published
Unlimited IELTS Writing Task 1 & 2 Essay Generator
Unlimited IELTS Speaking Part 1, 2, & 3 Sample Generator
Unlimited Usage Of Advanced Tools & AI Features
Priority Support within 24h (12-month plan only)

Due to the nature of our service and the provided free trials, payments are non-refundable.