🔥 Today Only: Save 30% on Premium — Offer Ends Soon! - Upgrade Now!
Table

Band 6+: The graph below shows the information about medical care in three European countries between 1980 and 2000.

Image for topic: The graph below shows the information about medical care in three European countries between 1980 and 2000.
Our system will evaluate the answer based on this AI-generated description.
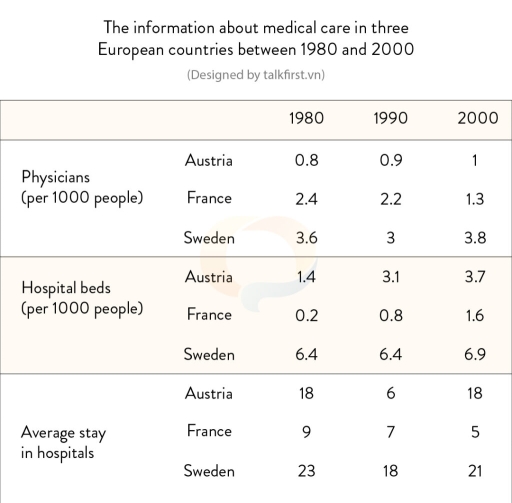
The image presents three tables with data about medical care in Austria, France, and Sweden between 1980 and 2000; the first table shows the number of physicians per 1000 people, where Austria had 0.8 in 1980, 0.9 in 1990, and 1 in 2000, France had 2.4 in 1980, 2.2 in 1990, and 1.3 in 2000, and Sweden had 3.6 in 1980, 3 in 1990, and 3.8 in 2000; the second table lists hospital beds per 1000 people, where Austria had 1.4 in 1980, 3.1 in 1990, and 3.7 in 2000, France had 0.2 in 1980, 0.8 in 1990, and 1.6 in 2000, and Sweden had 6.4 in both 1980 and 1990, and 6.9 in 2000; the third table contains data about the average stay in hospitals, indicating that Austria had 18 days in 1980, 6 days in 1990, and 18 days in 2000, France had a decreasing trend with 9 days in 1980, 7 days in 1990, and 5 days in 2000, and Sweden decreased from 23 days in 1980 to 18 days in 1990, then increased to 21 days in 2000.
Given the complexity of the image, the above description may not be entirely accurate.
Note: Both the topic and the answer were created by one of our users.

The given table compares data for medical care in Autria, France, and Sweden from 1980 to 2000.

Overall, it can be seen clearly that the figures for hospital beds in all three nations increased over the period of 20 years, while the opposite was true for the average stay in hospitals in France and Sweden. Besides, the average stay in hospitals in Austria unchanged over 20 years.

In 1980, the number of physicians per 1000 people in Austria stood at 0.8, rising slightly to 1 in 2000, which was much lower than the figure for Sweden, at 3.8. While the data for physicians in France decreased strongly to 1.3 per 1000 human in 2000. Besides, Sweden had the highest number of hospital beds, standing at 6.9 per 1000 people, which was much higher than the number of Autria and France, at 3.7 and 1.6.

Between 1980 and 2000, the average stay in hospitals in Austria unchanged, still standing at 18. While the figures for France declined slightly from 9 to 5 in 2000. The data for Sweden rose again to 21 in 2000, after falling down 18 in 1990.

Word Count: 189

Answers On The Same Topic:

The graph below shows the information about medical care in three European countries between 1980 and 2000.

The table compares three countries, namely Austria, France, and Sweden, in terms of physicians, hospital beds, and average days spent in hospitals between 1980 and 2000. Overall, the number of hospital beds showed increases in all countries, while the number of physicians and average days spent in hospital reported varying fluctuations. It is also noticeable […]

The graph below shows the information about medical care in three European countries between 1980 and 2000.

The table compares the number of physicians and hospital beds per 1000 people, together with the average length of hospital stays, in Austria, France and Sweden in 1980, 1990, and 2000. Overall, Sweden consistently had the highest number of hospital beds throughout the period, while France experienced a moderate decline in both the number of […]

The graph below shows the information about medical care in three European countries between 1980 and 2000.

The table provides information about three distinct categories in medical healthcare across three different countries, namely Austria, France, and Sweden during three years: 1980, 1990 and 2000. Overall, it is noticeable that Sweden recorded the highest figures in all given categories throughout the period. In addition, only the hospital beds section experienced an upward trend […]

The graph below shows the information about medical care in three European countries between 1980 and 2000.

The following graph shows the data about medical care in three European countries from 1980 to 2000. Overall, the biggest change was exhibited by Austria and France on Hospitals beds. The biggest proportion of each three sections (Physicians, Hospital beds, Average stay in hospitals) was belonged to Sweden over the period 1980 and 2000. The […]

The graph below shows the information about medical care in three European countries between 1980 and 2000.

The table compares how medical aspect change in three European nations from 1980 to 2000 Overall, it is clear that the figures for Sweden in all aspects were significantly higher than that of France and Austria. In 1980, Sweden had 3.6 physicians and 6.4 beds per 1000 people, and an average stay in hospitals of […]

See All

Other Topics:

The table below shows the consumption of wheat, rice, maize in 4 different countries.

The given table chart provides information about how wheat, maize and rice are consumed by inhabitants from different parts of the world: Combodia, Poland, Egypt and Mexico. As an overall trend, it is clear that some countries consume a certain type of main foods much more than others, whereas Polish people do not eat maize […]

The table provides information about household budgets in a European country from 1920 to 1980. Provide an overview of the information by identifying and describing the key details, and include comparisons where appropriate.

The given table compares the essential expenses across over five different categories in a European nation between 1920 to 1980. Overall, while there was an increase in spending money on housing, transportation and other unnamed aspect, people paid less money for groceries and clothing and the money spent on medical services remained unchanged. Additionally, transportation […]

question: WRITING TASK 1 You should spend about 20 minutes on this task. The table shows information about metro systems in six different cities. Summarise the information by selecting and reporting the main features and make comparisons where relevant. Write at least 150 words.

The table chart compares six underground railway systems in terms of number of lines, track length, annual passenger journeys and single metro ticket price. Overall, New York city has extensive metro network in terms of number of railway lines constructed and their total length, while Beijing and Tokyo witness the maximum number of annual metro […]

The tables below give information about sales of Fairtrade*-labelled coffee and bananas in 1999 and 2004 in five European countries.

The table presents data on the sales of Fairtrade-labeled coffee and bananas between 1999 and 2004 in five European countries: the UK, Switzerland, Denmark, Belgium, and Sweden. In terms of coffee sales, Sweden had the lowest sales of Fairtrade-labeled coffee and bananas, starting at 0.8 million euros and increasing to 1 million euros by 2004. […]

the illustration below shows the proportions of people living in different types of houses in three different areas in 2012 in Denmark.

The chart demonstrate the percentage of civillians living in four different kinds of residents in various regions of Denmark during 2012. Overall, it can be seen that Central area was filled with the most population compared to the other two regions ,while Southberg came as the second highest. It is noticeable that Green Park area […]

The graph below shows the percentage of mobile phone owners using various mobile phone features in Vietnam in the year 2005, 2008, 2010.

The table provides that, the percentages of mobile phone owners in vetnam who used various mobile phone features in 2005, 2008 and 2010 years. Overall, making calls was the most common mobile phone feature throughout the period. The figure remained at 100% in both 2005 and 2008 before decreasing slightly to 97% in 2010. Taking […]

See All
We have detected unusual activity on your device.
Please verify your identity to continue.
Note: This verification step won't sign you in. If you have a premium account, please log in to access the service as usual.
Google/Gmail Verification
Or verify using Email/Code
We've sent a verification code to:
youremail@gmail.com (Not your email?)
Enter it below to complete the verification process.
Ensure your email address is correct, your inbox is not full, and you check your spam folder. If no email arrives, consider using an alternative email.
You will need a Premium plan to perform your action!
Note: If you already have a premium account, please log in to access our services as usual.

Plans & Pricing

Our mission is to make quality education accessible for everyone.
However, to keep our hardworking team running and this service alive, we genuinely need your support!
By opting for a premium plan, not only do you sustain us in achieving the mission, but you also unlock advanced features to enrich your learning experience.

Free

For learners who aren't pressed for time

What's included on Free
100+ Cambridge IELTS Tests
Instant IELTS Writing Task 1 & 2 Evaluation (2 times/month)
Instant IELTS Speaking Part 1, 2, & 3 Evaluation (5 times/month)
Instant IELTS Writing Task 1 & 2 Essay Generator (2 times/month)
500+ Dictation & Shadowing Exercises
100+ Pronunciation Exercises
Flashcards
Other Advanced Tools

Premium

For those serious about advancing their English proficiency, and for IELTS candidates aspiring to boost their band score by 1-2 points (especially in writing & speaking) in just 30 days or less

What's included on Premium
Save Your IELTS Test Progress
Unlock All Courses & IELTS Tests
Unlimited AI Conversations
Unlimited AI Writing Enhancement Exercises
Unlimited IELTS Writing Task 1 & 2 Evaluation
Unlimited IELTS Speaking Part 1, 2, & 3 Evaluation
Checked Answers Will Not Be Published
Unlimited IELTS Writing Task 1 & 2 Essay Generator
Unlimited IELTS Speaking Part 1, 2, & 3 Sample Generator
Unlimited Usage Of Advanced Tools
Priority Support within 24h (12-month plan only)

Due to the nature of our service and the provided free trials, payments are non-refundable.
Nếu bạn là người Việt Nam và không có hoặc không muốn trả bằng credit/debit cards, bạn có thể thanh toán bằng phương thức chuyển khoản:


Chọn gói:
419,000₫ 277,000 ₫ cho gói 1 tháng (chỉ 9,233₫/ngày)
1,239,000₫ 597,000 ₫ cho gói 3 tháng (chỉ 6,633₫/ngày)
2,469,000₫ 1,027,000 ₫ cho gói 6 tháng (chỉ 5,706₫/ngày)
4,929,000₫ 1,417,000 ₫ cho gói 12 tháng (chỉ 3,936₫/ngày)


Sau khi chuyển khoản, vui lòng đợi trình duyệt tự động điều hướng bạn trở lại Engnovate và bạn sẽ ngay lập tức nhận được mã kích hoạt tài khoản premium.
Nếu có lỗi xảy ra, bạn có thể liên hệ với team thông qua một trong các phương thức: email đến helloengnovate@gmail.com hoặc nhắn tin qua facebook.com/engnovate.
Vì toàn bộ công cụ trên website đều có thể sử dụng thử miễn phí, Engnovate không hỗ trợ hoàn tiền.