Our system will evaluate the answer based on this AI-generated description.
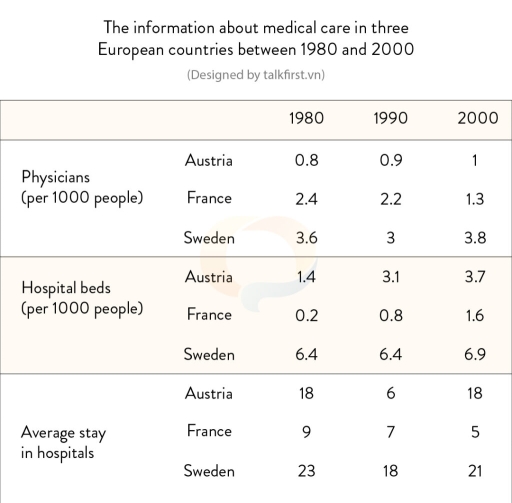
The image presents three tables with data about medical care in Austria, France, and Sweden between 1980 and 2000; the first table shows the number of physicians per 1000 people, where Austria had 0.8 in 1980, 0.9 in 1990, and 1 in 2000, France had 2.4 in 1980, 2.2 in 1990, and 1.3 in 2000, and Sweden had 3.6 in 1980, 3 in 1990, and 3.8 in 2000; the second table lists hospital beds per 1000 people, where Austria had 1.4 in 1980, 3.1 in 1990, and 3.7 in 2000, France had 0.2 in 1980, 0.8 in 1990, and 1.6 in 2000, and Sweden had 6.4 in both 1980 and 1990, and 6.9 in 2000; the third table contains data about the average stay in hospitals, indicating that Austria had 18 days in 1980, 6 days in 1990, and 18 days in 2000, France had a decreasing trend with 9 days in 1980, 7 days in 1990, and 5 days in 2000, and Sweden decreased from 23 days in 1980 to 18 days in 1990, then increased to 21 days in 2000.
Given the complexity of the image, the above description may not be entirely accurate.
Skyrocket your IELTS band score by 1-2 points in under a month with our premium plan!
Note: Both the topic and the answer were created by one of our users.
The table compared data of physicians, hospital beds and average stay in hospital in three particulars European nations from 1980 to 2000.
Overall, the figure of Sweden in all aspect always higher than both Austria as well as France through the periods
In terms of physicians, while the data of both Austria and Sweden had gently increase, which from 0,8 to 1 and 3,6 to 3,8 respectively. The figure for France tended to decrease around 1,1 in 3 years. Additionally, regarding Hospital beds, it is clear that the figure of Austria had the strongest increase (around 2,3 beds per 1000 people), whereas France rose progressively from 0,2 to 1,6. Likewise, the data of Sweden initially remained stable at 6,4 before increase suddenly to 6,9 in 2000.
The average stay in hospitals in Austria witnessed the fluctuation through 3 stages, with the decrease substantial from 18 to 6 during the first 2 years before regaining the original position in the last period. The number stays of France declined steadily from 9 to 5 through the period and the opposite changes can be seen in the figures for Sweden, which also grew substantially from 23 to 21 in 3 stages.
Word Count: 198