Our system will evaluate the answer based on this AI-generated description.
The image shows a line graph comparing the number of contacts made through different methods (in-person, letter/email, and telephone) over a six-month period. In January, in-person contacts were the highest at 800, letter/email were at 200, and telephone at 600. In February, in-person contacts slightly decreased to 700, letter/email increased to 400, and telephone remained the same. In March, in-person contacts jumped to 1,600, letter/email decreased to 200, and telephone increased to 1,000. In April, in-person contacts reached 1,800, letter/email stayed at 200, and telephone increased to 1,200. In May, in-person contacts remained at 1,800, letter/email increased to 400, and telephone reached 1,400. In June, in-person contacts rose to 1,900, letter/email stayed at 400, and telephone peaked at 1,700. The graph has a Y-axis labeled from 0 to 2000 at intervals of 200 and an X-axis labeled with the months January to June.
Given the complexity of the image, the above description may not be entirely accurate.
Skyrocket your IELTS band score by 1-2 points in under a month with our premium plan!
Note: Both the topic and the answer were created by one of our users.
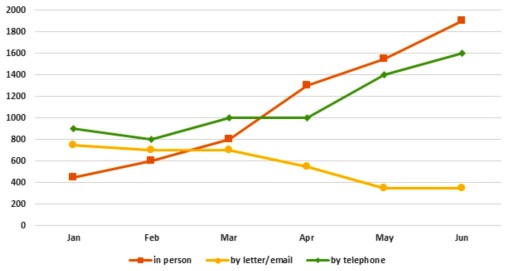
The line chart details the information about how many times people opt for various means of communications to send inquiries for the Tourist Information Office in 2011, between January and June. Looking from an overall perspective, it is readily apparent that there are dynamic ways of making more inquiries in person and by telephone, while the number of letter/email was shrinking.
In the first three months, the quantity of queries by telephone was the highest number, fluctuating between 800 and 1000 by April. As for personal queries, the number of it sharply was increasing by each month and peaked with below 2000 enquiries by June, becoming the leader from April. Conversely, letter and email requests were moderately falling from approximately 800 to under 400 by the end of the period.
The first quarter of 2011 illustrates that the preferences mostly did not change with phones as the main. Only in the last month of its quarter, the sum of all personal requests became more than by mail. Furthermore, in the next half of the provided period people tried to get information in person.
To summarize, the personal and phone turnt into the particularly types of enquiries, while the letter/email had a downward trend.
Word Count: 203
