Our system will evaluate the answer based on this AI-generated description.
The image displays a line graph illustrating international tourists in millions visiting France, USA, and Japan from 2000 to 2020. France's data: 2000 (77), 2001 (79), 2002 (81), 2003 (83), 2004 (82), 2005 (83), 2006 (84), 2007 (86), 2008 (88), 2009 (87), 2010 (85), 2011 (86), 2012 (86), 2013 (84), 2014 (85), 2015 (87), 2016 (86), 2017 (88), 2018 (89), 2019 (90), 2020 (91). USA's data: 2000 (51), 2001 (52), 2002 (53), 2003 (54), 2004 (55), 2005 (56), 2006 (57), 2007 (57), 2008 (56), 2009 (55), 2010 (54), 2011 (53), 2012 (52), 2013 (51), 2014 (50), 2015 (49), 2016 (47), 2017 (45), 2018 (44), 2019 (42), 2020 (42). Japan's data: 2000 (15), 2001 (15), 2002 (16), 2003 (17), 2004 (17), 2005 (19), 2006 (20), 2007 (21), 2008 (23), 2009 (24), 2010 (25), 2011 (27), 2012 (28), 2013 (30), 2014 (33), 2015 (36), 2016 (41), 2017 (47), 2018 (52), 2019 (54), 2020 (50).
Given the complexity of the image, the above description may not be entirely accurate.
Skyrocket your IELTS band score by 1-2 points in under a month with our premium plan!
Note: Both the topic and the answer were created by one of our users.
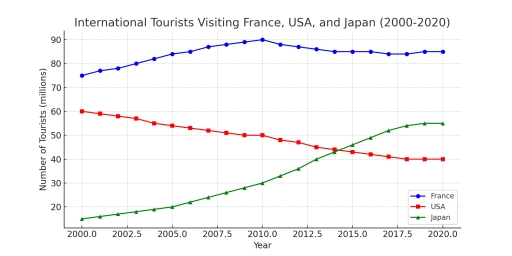
The line graph provides information about the proportion of foreign visitors who traveled to France, USA, and Japan over the twenty-year period from 2000 to 2020. The units are measured in millions of tourists. Overall, it is clear that the number of tourists visiting France and Japan increased although in a different degree, the trend in the share of travelers was downward in the USA with France being the most popular tourist destination over a period considered.
The most significant rise in the proportion of international travelers was observed in Japan where the number of visitors increase fivefold from approximately 10 million to around 55 million. Due to the growth Japan became the second most popular country since 2014 while in 2000 Japan was the least attractive country. A less marked growth was noticeable in France amounting to approximately 10 million with the peak of 90 million being reached in 2010.
The number of tourists visiting the USA decreased dramatically by 20 million, from about 60 to 40 million. It is noticeable that the USA began to occupy the third place in terms of the share of visitors after 2014.
Word Count: 190