Our system will evaluate the answer based on this AI-generated description.
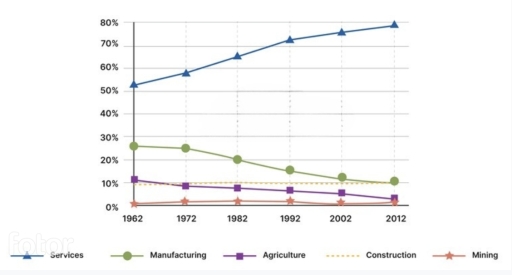
The image shows data trends from 1962 to 2012 for Services, Manufacturing, Agriculture, Construction, and Mining; in 1962, Services at 40%, Manufacturing at 25%, Agriculture at 30%, Construction at approximately 3%, and Mining at 2%; in 1972, Services at 50%, Manufacturing at approximately 21%, Agriculture at 25%, Construction at 2%, and Mining at around 2%; in 1982, Services at 55%, Manufacturing at approximately 15%, Agriculture at 19%, Construction at 2%, and Mining at around 1%; in 1992, Services at 60%, Manufacturing at around 10%, Agriculture at 14%, Construction at approximately 2%, and Mining at around 1%; in 2002, Services at 70%, Manufacturing at approximately 7%, Agriculture at 11%, Construction at 2%, and Mining at less than 1%; in 2012, Services at around 78%, Manufacturing at 6%, Agriculture at 9%, Construction at around 2%, and Mining at less than 1%.
Given the complexity of the image, the above description may not be entirely accurate.
Skyrocket your IELTS band score by 1-2 points in under a month with our premium plan!
Note: Both the topic and the answer were created by one of our users.
The line graph depicts the population of Australian workers in five distinct sectors during five decades staring from 1962.
From an overall perspective, it is readily apparent that the percentage of workforce had dropped over the period with exception in the service industry. Services was by far the most participated field while mining generated the least interest. Pattern of decline seemed to be the same for manufacturing and agriculture areas.
From the observation of the data in 1962, services was in the top of the list with just over 50% while mining had null. Agriculture and construction were in same position with 10% which remained almost alike by 1982. There was little fluctuations in 1972 excluding construction. In 1982, growth can be found in services however, manufacturing experienced a decline reaching 20%.
By 1992, services faced sharp increase crossing 70% whereas manufacturing repeatedly dropped. In 2002, only services attracted the pupils and a constant data was seen in construction. At the end of the survey, agriculture and mining had least workers and manufacturing and construction listed as mediocre amount which is 10%. Services remained uncomparable with 80% individuals.
Word Count: 188