Our system will evaluate the answer based on this AI-generated description.
The image contains a line graph with four lines representing UK acid rain emissions in million tonnes from four different sectors (Transport and communication, Other industries, Electricity, Gas and Water Supply, Domestic) between 1990 and 2007; Transport and communication starts at 2 million tonnes in 1990, dips to just above 1.5 million tonnes in 1995, rises to nearly 2 million tonnes in 1999, then gradually decreases to around 1.2 million tonnes in 2007; Other industries starts at around 1.3 million tonnes in 1990, slowly decreases to just above 1 million tonnes in 2003, then dips to around 0.7 million tonnes in 2007; Electricity, Gas and Water Supply starts at nearly 3.5 million tonnes in 1990, sharply decreases to around 1.5 million tonnes in 2003, then gradually falls to about 0.5 million tonnes in 2007; Domestic starts at just below 0.5 million tonnes in 1990, has a slight rise to about 0.6 million tonnes in 1993, then follows a steady decline to nearly 0.2 million tonnes in 2007.
Given the complexity of the image, the above description may not be entirely accurate.
Skyrocket your IELTS band score by 1-2 points in under a month with our premium plan!
Note: Both the topic and the answer were created by one of our users.
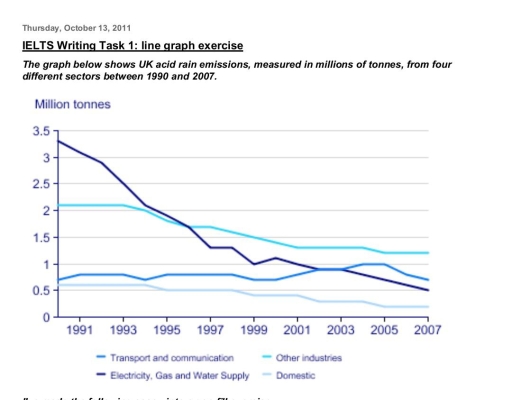
The shown line graph compares four regions in terms of sum of acid rain emmissions that was produced during a period of 17 years in the UK.
It’s clearly seen that total proportion of acid rain emmissions in the UK drammaticly knocked down between 1990 and 2007. The most significant diminish was seen in the electricity, gas and water supply part.
In this diagram, there are four causers of acid rain emmissions. In 1990, Electricity, gas and water supply sector was the main reason for enormous of acid rain, with around 3.5 million tonnes. While Domestic factor showed the most minimum index, with a little high 0.5 million tonnes and decreased slightly by 2007. However, the diagram is given for Electricity, Gas and Water supply showed plummeting over a period of 17 years.
The second main thing that caused acid rain was other industries, beginning it produced acid rain emissions just over 2 million tonnes, but at the end of this period, this indicator slumped around 0.8 million tonnes. On the other hand, there was slightly increas was seen the given data for Transport and communication almost remained the same from 1990 to 2007.
Word Count: 194