Our system will evaluate the answer based on this AI-generated description.
The image presents a line graph depicting average house prices for Country A, Country B, and Country C from 1997 to 2014; in 1997, Country A was at $150k, Country B at $80k, Country C at $130k; by 1998, Country A increased to $180k, Country B to $100k, Country C to $135k; by 1999, Country A rose to $190k, Country B to $120k, Country C decreased to $125k; in 2000, Country A at $220k, Country B at $150k, Country C back at $130k; by 2001, Country A surged to $270k, Country B $170k, Country C at $150k; in 2002, Country A dramatically rose to $350k, Country B to $195k, Country C to $180k; by 2003, Country A reached $450k, Country B $200k, Country C $230k; in 2004, Country A hit $500k, Country B $210k, Country C $250k; by 2005, Country A dipped to $480k, Country B to $205k, Country C $260k; in 2006, Country A at $490k, Country B $180k, Country C $300k; by 2007, Country A rose again to $510k, Country B $170k, Country C $310k; in 2008, Country A grew to $540k, Country B $150k, Country C $320k; by 2009, Country A $550k, Country B $145k, Country C peaked at $400k; in 2010, Country A at $560k, Country B $130k, Country C $390k; by 2011, Country A $590k, Country B $135k, Country C $320k; in 2012, Country A grew to $600k, Country B $140k, Country C $330k; by 2013, Country A rose to $680k, Country B $150k, Country C $350k; in 2014, Country A peaked at $750k, Country B $160k, Country C $420k.
Given the complexity of the image, the above description may not be entirely accurate.
Skyrocket your IELTS band score by 1-2 points in under a month with our premium plan!
Note: Both the topic and the answer were created by one of our users.
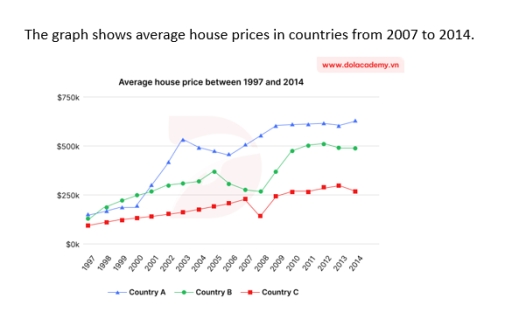
The graph depicts information about approximate house prices in countries between 2007 and 2014.
Overall, between 2007 and 2014, there was a dramatic improvement. In 2007, countries A, B, and C all showed an upward trend: country A at just under $500K, country B at almost $300K, and country C at just under $250K. In 2008, country A rose, but countries B and C dropped dramatically; country A was at just over $500K, although country B was at just over $250K and country C decreased to half of $250K. However, between 2009 and 2010, all countries jumped suddenly. In 2010, country A was approximately at $600K, country B rose steeply to $500K, and country C was at well over $250K.
In conclusion, from 2009 to 2014, the information given shows all countries stabilized. This means the economic system around the world changed slightly. Even though house prices always increased, many people desire. This means it will affect the cost of living in all countries.
Word Count: 164