Our system will evaluate the answer based on this AI-generated description.
The image presents a line graph depicting average house prices for Country A, Country B, and Country C from 1997 to 2014; in 1997, Country A was at $150k, Country B at $80k, Country C at $130k; by 1998, Country A increased to $180k, Country B to $100k, Country C to $135k; by 1999, Country A rose to $190k, Country B to $120k, Country C decreased to $125k; in 2000, Country A at $220k, Country B at $150k, Country C back at $130k; by 2001, Country A surged to $270k, Country B $170k, Country C at $150k; in 2002, Country A dramatically rose to $350k, Country B to $195k, Country C to $180k; by 2003, Country A reached $450k, Country B $200k, Country C $230k; in 2004, Country A hit $500k, Country B $210k, Country C $250k; by 2005, Country A dipped to $480k, Country B to $205k, Country C $260k; in 2006, Country A at $490k, Country B $180k, Country C $300k; by 2007, Country A rose again to $510k, Country B $170k, Country C $310k; in 2008, Country A grew to $540k, Country B $150k, Country C $320k; by 2009, Country A $550k, Country B $145k, Country C peaked at $400k; in 2010, Country A at $560k, Country B $130k, Country C $390k; by 2011, Country A $590k, Country B $135k, Country C $320k; in 2012, Country A grew to $600k, Country B $140k, Country C $330k; by 2013, Country A rose to $680k, Country B $150k, Country C $350k; in 2014, Country A peaked at $750k, Country B $160k, Country C $420k.
Given the complexity of the image, the above description may not be entirely accurate.
Skyrocket your IELTS band score by 1-2 points in under a month with our premium plan!
Note: Both the topic and the answer were created by one of our users.
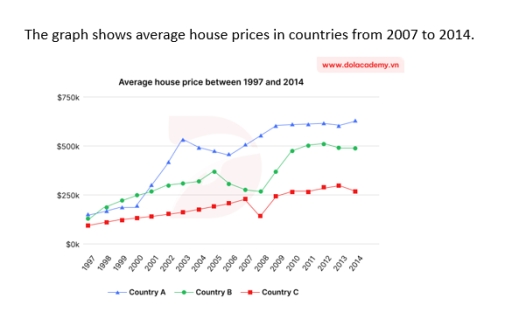
The line chart illustrates the average of house prices in certain countries – A, B, C respectively – between 2007 and 2014
Overall, the average house price in all examined countries witnessed an upward trajectory. Additionally, the country C experienced a slight decline before recovering after that.
The house price in country B stood at 500 dollars in 2007, which rose significantly to approximately 630 dollars in 2014. In contrast, the period from 2007 to 2014 showed a slight decline in the house price of country B, decreasing from around 260 dollars to nearly 250 dollars. However, the amount of money increased dramatically to over 500 dollars in 2012 and then fell slightly to nearly 490 dollars at the end of the duration.
Meanwhile, there was a moderate fluctuation in country C between 2007 and 2009. The pay for house started at nearly 250 dollars, decreasing notably to nearly 170 dollars in 2008 before recovering to the initial value in 2009. The increase continued until 2013, standing at roughly 270 dollars. Nevertheless, the cost for house eventually fell marginally to over 250 dollars in the end of the period.
Word Count: 189