🔥 Today Only: Save 30% on Premium — Offer Ends Soon! - Upgrade Now!
Line Graph

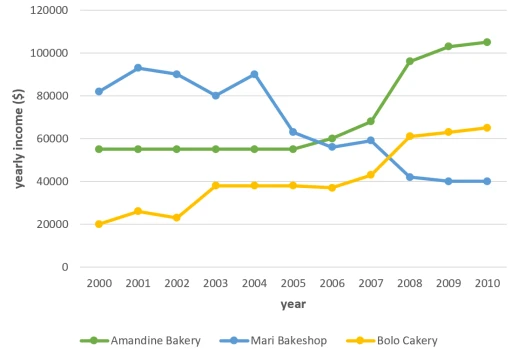
Band 6+: The graph shows data about the annual earnings of three bakeries in Calgary, 2000-2010.

Image for topic: The graph shows data about the annual earnings of three bakeries in Calgary, 2000-2010.
Our system will evaluate the answer based on this AI-generated description.
The image depicts a line graph showing the yearly income of three different bakeries from 2000 to 2010. Amandine Bakery is represented by a green line, Mari Bakeshop by a blue line, and Bolo Cakery by a yellow line. Amandine Bakery's income starts at around $55,000 in 2000, decreases slightly to around $53,000 in 2001, jumps to around $85,000 in 2002, remains steady until 2005, dips to around $83,000 in 2006, then steadily increases to reach its peak of around $105,000 in 2009 before dipping to around $100,000 in 2010. Mari Bakeshop's income starts at around $45,000 in 2000, steadily increases to around $50,000 in 2002, drops to around $45,000 in 2003, jumps to around $65,000 in 2004, decreases to around $63,000 in 2005, then steadily increases to reach its peak of around $85,000 in 2009 before decreasing slightly to around $80,000 in 2010. Bolo Cakery's income starts at around $30,000 in 2000, steadily increases to around $40,000 in 2004, jumps to around $50,000 in 2005, then steadily increases to reach its peak of around $70,000 in 2009 before decreasing slightly to around $68,000 in 2010.
Given the complexity of the image, the above description may not be entirely accurate.
Note: Both the topic and the answer were created by one of our users.

The line graph illustrates the amount of income from three different bakery shops in Calgary over the decade since 2000. The figures are given in dollars.

Overall, it is apparent that while Mari initially earned the most income, the lowest noticeable was by this shop in the end period, compared to others, Amandine and Bolo experienced an upward trend, reaching the top two highest by 2010.

To begin with, there was a disperation between these three shops, proportionately Bolo starting from 2000 dollars earned, with triple and quadruple in Amandine and Mari, respectively. After 3 years, there were significant fluctuations in the income of bakeries in Mari similar to Bolo, while the former exhibited a slight drop, the latter soared by double amounts by its beginning. However, Amandine just remained stable during these times.

Word Count: 134

Answers On The Same Topic:

The graph shows data about the annual earnings of three bakeries in Calgary, 2000-2010.

The line graph presented details the annual revenues of three distinct bakeries in Calgary from 2000 to 2010, specifically Amandine Bakery, Mari Bakeshop, and Bolo Cakery. Overall, Amandine Bakery and Bolo Cakery demonstrated a consistent upward trend in annual income, while Mari Bakeshop experienced fluctuations, culminating in a notable decrease by the end of the […]

The graph shows data about the annual earnings of three bakeries in Calgary, 2000-2010.

The graph illustrates the earnings of three bakeries in Calgary over a ten-year period from 2000 to 2010. Overall, it is evident from the graph that both Bolo Cakery and Amandine Bakery experienced significant upward trends in their income, while Mari Bakeshop saw a substantial decline during the same period. Interestingly, Mari Bakeshop was the […]

The graph shows data about the annual earnings of three bakeries in Calgary, 2000-2010.

The line graph illustrates the yearly profits of three bakeries in Calgary—Amandine, Bolo, and Mari—from 2000 to 2010. Overall, Amandine Bakery experienced a significant increase in profit, Bolo Bakery showed steady growth, and Mari Bakeshop saw a downturn over the decade. In 2000, Mari Bakeshop had the highest earnings at approximately $81,000, followed by Amandine […]

The graph shows data about the annual earnings of three bakeries in Calgary, 2000-2010.

The line graph presents the data about the amount of money which was earned by three bakeries in Calgary, over a ten-year period between 2000 and 2010. Overall, Mari Bakeshop experienced the most significant variability in yearly income. Amandine Bakery, in the other hand, commenced with minor variants, but ended the year with the highest […]

The graph shows data about the annual earnings of three bakeries in Calgary, 2000-2010.

The line chart illustrates the yearly revenue of three bakeries in Calgary between 2000 and 2010. Overall, Amandine Bakery and Bolo Cakery showed a gradual increase in their revenue, while Mari Bakeshop experienced a significant decline during this period. Although Mari Bakeshop was the most popular at the beginning of 2000, Amandine Bakery eventually surpassed […]

See All

Other Topics:

The graph below shows the spending of UK residents on visits abroad between 1993 and 2013. Summarise the information by selecting and reporting the main features, and make comparisons where relevant.

The graph illustrates the spending of UK residents on visits abroad for different aims: holiday, business, visiting friends or relatives or miscellaneous, between 1993 and 2013. Overall, holiday was the main factor during 20-year period. It showed upward trend, while other spendings were relatively stable, and low. In 1993, UK residents spent ~9 about billion […]

The graph below shows the percentage of adults in the UK who used various communication methods on a daily basis from 2005 to 2023. Summarise the information by selecting and reporting the main features and make comparisons where relevant.

The given chart gives information about preferences of grown-up individuals in daily used communication methods in the United Kingdom over a twenty-year period. Overall, it is clear that some of the categories raised popularity over two decades, such as Video Calling, Social Media Messaging, and Mobile Voice Calls . While other two options-Text Messaging and […]

The graphs below show Twitter use by age groups in the USA between November 2010 and May 2013. Summarise the information by selecting and reporting the main features, and make comparisons where relevant.

The graph illustrates the percentage of Twitter users by age groups, according to a survey in the United States between 2010 and 2013. Firstly, usage of this social media by people 65+ remained constant. By contrast, the 18-29 group increased dramatically and doubled from 2010 to 2013. The same tendency has the 30-49 and the […]

The line graph shows the past and projected finances for a local authority in New Zealand.

The given graph depicts data on the primary and forecasted finances concerning local government in New Zealand. The provided figures are illustrated in billions of dollars. Overall, it is evident that debts experience fluctuations, while income rates and user charges lines are witnessing steady incline. Also it is worth noticing that grants and allocations decrease […]

The graph below shows the number of enquiries received by the Tourists Information Office in one city over a six-month period in 2011.

The line graph illustrates how many requestes obtained by the Tourists Information Office in one city over six-month period in 2011. Overall, requestes collected in person is the most popular, following with by telephone on the second place, and letter/email conversations which popularity decrease over the six-month period. Starting with, person requestes was the lowest […]

The graph below shows the number of overseas visitors who came to Japan for different purposes between 1990 and 2010. Su mmarize the in formation by sele cting and re port ing the main features , and make comparisons where relevant . Writ e at least 150 words .

The line graph illustrates the number of overseas visitors who travelled to Japan for three different purposes between 1990 and 2010, namely business, holidays and visiting friends. Overall, the number of visitors increased in all three categories over the period. Business travel remained the most common purpose for most of the years, although it experienced […]

See All
We have detected unusual activity on your device.
Please verify your identity to continue.
Note: This verification step won't sign you in. If you have a premium account, please log in to access the service as usual.
Google/Gmail Verification
Or verify using Email/Code
We've sent a verification code to:
youremail@gmail.com (Not your email?)
Enter it below to complete the verification process.
Ensure your email address is correct, your inbox is not full, and you check your spam folder. If no email arrives, consider using an alternative email.
You will need a Premium plan to perform your action!
Note: If you already have a premium account, please log in to access our services as usual.

Plans & Pricing

Our mission is to make quality education accessible for everyone.
However, to keep our hardworking team running and this service alive, we genuinely need your support!
By opting for a premium plan, not only do you sustain us in achieving the mission, but you also unlock advanced features to enrich your learning experience.

Free

For learners who aren't pressed for time

What's included on Free
100+ Cambridge IELTS Tests
Instant IELTS Writing Task 1 & 2 Evaluation (2 times/month)
Instant IELTS Speaking Part 1, 2, & 3 Evaluation (2 times/month)
Instant IELTS Writing Task 1 & 2 Essay Generator (2 times/month)
500+ Dictation & Shadowing Exercises
100+ Pronunciation Exercises
Flashcards
Other Advanced Tools

Premium

For those serious about advancing their English proficiency, and for IELTS candidates aspiring to boost their band score by 1-2 points (especially in writing & speaking) in just 30 days or less

What's included on Premium
Save Your IELTS Test Progress & Analyze Mistakes By Question Type
Save Your Own Flashcard Sets & Use Them On Any Device
Unlock All Courses, IELTS Tests, Section & Part Practice
Unlimited AI Conversations
Unlimited AI Writing Enhancement Exercises
Unlimited IELTS Writing Task 1 & 2 Evaluation
Unlimited IELTS Speaking Part 1, 2, & 3 Evaluation
Checked Answers Will Not Be Published
Unlimited IELTS Writing Task 1 & 2 Essay Generator
Unlimited IELTS Speaking Part 1, 2, & 3 Sample Generator
Unlimited Usage Of Advanced Tools & AI Features
Priority Support within 24h (12-month plan only)

Due to the nature of our service and the provided free trials, payments are non-refundable.