Our system will evaluate the answer based on this AI-generated description.
The image illustrates a graph marking the favorite sports in Canada from 1985 to 2015 across American football, basketball, hockey, baseball, and boxing. Hockey witnessed a consistent lead over other sports, starting at 35% in 1985, then 35% in 1990, rising to 40% in 1995, holding at 40% in 2000, further climbing to 45% in 2005, maintaining 45% in 2010, and retaining 45% in 2015. Basketball displayed increases and fluctuations: 30% in 1985, rising to 35% in 1990, dipping to 25% in 1995, rising again to 30% in 2000, fluctuating between 30% in 2005, then dropping to 20% in 2010 before ascending to 25% in 2015. American football depicted a steady upward trajectory: starting at 10% in 1985, then 15% in 1990, increasing slightly to 20% in 1995, reaching 25% in 2000 and 2005, followed by a jump to 35% in 2010, rising sharply to 40% in 2015. Baseball maintained relatively constant proportions, illustrating 15% in 1985, hesitating between 10% in 1990, then climbing back to 15% in 1995 and 2000, further dipping to 10% in 2005, reaching its lowest at 5% in both 2010 and 2015. Boxing remained primarily stagnant with minimal fluctuations: initiated at 5% in 1985, retaining 5% in 1990, descending to 5% in 1995, staying constant at 5% up till 2005, experiencing mild uplift to 10% in 2010, before equaling 5% again in 2015.
Given the complexity of the image, the above description may not be entirely accurate.
Skyrocket your IELTS band score by 1-2 points in under a month with our premium plan!
Note: Both the topic and the answer were created by one of our users.
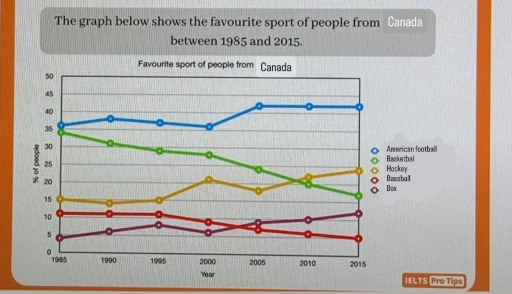
The line graph illustrates the favourite sport of Canadian citizens over a 30-year period from 1985 to 2015.
Overall, it is clear that the popularity of some sports increased, while others declined. Over the period shown, there was a general upward trend in American football, whereas basketball remained relatively stable.
American football grew significantly, reaching a peak of 43 million fans in 2015. This sport had approximately with 35 million fans in 1990, and by 2005, the number had skyrocketed to almost 45 million. Basketball was stable with 35 million from 1985 to 2000 . However, in 2005 the statistics dropped dramatically to 20 million
Among the remaining sports, hockey was significantly more preferred than box and baseball throughout the interval. While baseball consistently outperformed box, the gap between them narrowed from 10 million to 5 million. These trends highlight the changing preferences in sports within Canada during the period.
Word Count: 150