Our system will evaluate the answer based on this AI-generated description.
The image is a line graph titled "Number of tourists visiting the Galapagos Islands (2015 - 2022)" with three lines representing different categories of tourists - Visitors staying on cruise ships, Visitors staying on island, and Total visitors. The y-axis shows Millions of visitors ranging from 0 to 4, in increments of 0.8, and the x-axis represents the years from 2015 to 2022. In 2015, cruise ship visitors were approximately 0.7 million, island visitors were about 0.3 million, adding up to a total of 1 million. By 2022, the trend projected is cruise ship visitors just above 1.6 million, island visitors near 1.2 million, totaling pretty close to 2.8 million visitors. Each year shows a steady increase with cruise ship visitors always surpassing island visitors, and the total line consistently rising over the years with a slight plateau between 2019 and 2020.
Given the complexity of the image, the above description may not be entirely accurate.
Skyrocket your IELTS band score by 1-2 points in under a month with our premium plan!
Note: Both the topic and the answer were created by one of our users.
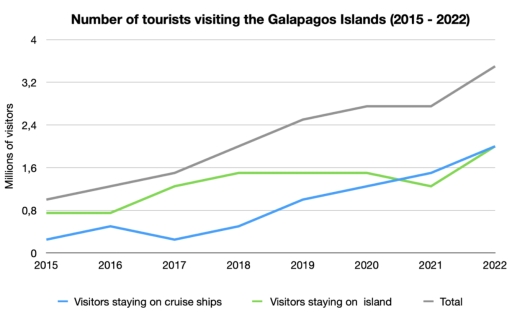
The given graph provides information about how many people visited the Galapagos Islands in a certain time period. Due to the illustration, it is more vivid to understand what possible drove the tourists to visit the islands and where the possible peak of the most visitors is.
To begin with, a part of the tourists staying on cruise ships, which was at 2015, very little but grew a small amount in the next year. Although the number got higher, it declined immediately in 2017. Since then, the graph increased continually till 2022 and reached a sum of roundabout 1,6 million visitors.
When looking at the people who stayed at hotels, the island visitors in 2015 till 2016 where steady at 0,8 millions and claimed up close to 1,6 millions in the next two years. Where this number also remains stable for another two years. The graph then sinks a small amount in 2021 but rises up again till 2022, where the hotel visitors are the same amount as the ones on the cruise ship.
Although the two graphs showed decreasing instances, the overall number of tourists increased from 2015 till 2022.
Word Count: 191