Our system will evaluate the answer based on this AI-generated description.
The image shows a line graph titled 'PARTICIPATION BY CLUB MEMBERS' with the Y-axis labeled '% OF CLUB MEMBERS' ranging from 0% to 60% in increments of 10%, and the X-axis labeled 'YEAR' with markers for 1995, 2000, 2005, 2010, 2015. Three lines represent swimming, team sports, and gym activities. In 1995, swimming starts at just below 50%, team sports at just above 30%, and gym activities at just over 20%. By 2000, swimming decreases to just over 40%, team sports increase to just over 40%, and gym activities rise to about 25%. In 2005, swimming continues to decline to around 35%, team sports drops to just above 30%, gym activities climb to just over 30%. By 2010, swimming reaches around 30%, team sports rises to above 35%, and gym activities peak at near 40%. In 2015, swimming stabilizes around 30%, team sports decreases slightly to just under 35%, and gym activities dip to just below 40%.
Given the complexity of the image, the above description may not be entirely accurate.
Skyrocket your IELTS band score by 1-2 points in under a month with our premium plan!
Note: Both the topic and the answer were created by one of our users.
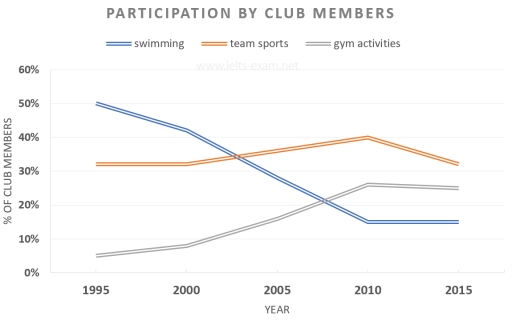
The line graph illustrates changes in participation rates for swimming, team sports, and gym activities among club members from 1995 to 2015.
Overall, there were significant shifts in the popularity of these activities. Gym activities saw a dramatic increase in participation, while swimming experienced a sharp decline. Meanwhile, team sports initially grew in popularity before leveling off in later years.
In 1995, swimming was the most popular activity, with around 50% of club members participating. However, this figure declined steadily over the next two decades, dropping to just under 25% by 2015. In contrast, participation in gym activities rose significantly, starting at roughly 10% in 1995 and increasing to almost 30% by 2005. By 2015, gym activities were the second most popular activity, with about 35% participation.
Team sports showed a different trend. Participation increased moderately from 30% in 1995 to a peak of 40% in 2005, surpassing swimming. However, after 2005, the figure remained stable, fluctuating slightly around 40%.
Word Count: 160