Our system will evaluate the answer based on this AI-generated description.
The image depicts a line chart titled "U.S. Energy Consumption by Fuel (1980-2030)" with six labeled lines representing "Petrol and Oil," "Coal," "Natural Gas," "Nuclear," "Solar/Wind," and "Hydropower." The chart's X-axis spans from 1980 to 2030, with the years 1985, 1995, 2005, 2010, 2015, 2020, and 2025 marked. The Y-axis measures quadrillion units from 0 to 50, in increments of 5. "Petrol and Oil" begins at approximately 30 quadrillion units in 1980, peaking near 45 in 2010 and projected to rise slightly above that by 2030. "Coal" starts near 15, peaks at 25 around 2005, and is projected to decline to just above 20. "Natural Gas" begins below 15, surpasses "Coal" near 2010 just under 25, and is expected to reach 30 by 2030. "Nuclear" maintains a steady rise from 5 in 1980 to a projected 10 in 2030. "Solar/Wind" starts at 0, shows a sharp increase after 2010, and is projected to surpass "Nuclear" by 2030, reaching approximately 15. "Hydropower" hovers consistently around 5 quadrillion units throughout the timeline.
Given the complexity of the image, the above description may not be entirely accurate.
Skyrocket your IELTS band score by 1-2 points in under a month with our premium plan!
Note: Both the topic and the answer were created by one of our users.
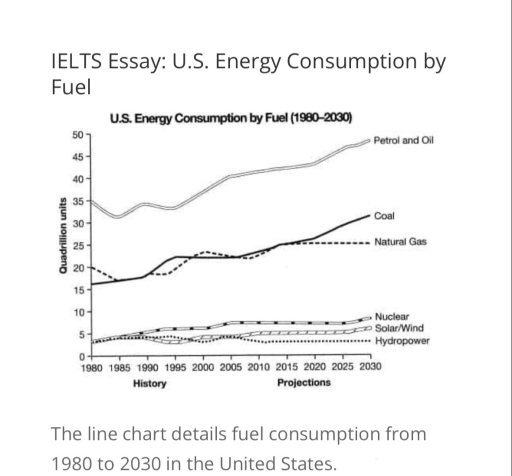
The provided line chart compares the consumption of different types of fuel from 1980 as well as predict the quantity usage for year 2030.
Overall, petrol and oil has been predominately used over years while coal and natural gas are used mildly. There is less consumption of fuel i.e. Nuclear, Solar/Wind and Hydropower.
Although there are few dips in consumption of petrol and oil, it usage has been rising steadily from 1980 to 2025 and expected to increase to 50 quadrilions units in 2030. There is similar fluctutation and rises in usage of coal and natural gases from 1930 to 2025. However, consumption of coal is deemed to rise in 2030 in comparison to natural gas which remains steady.
There is minimum gaps in quantity of fuel consumed in 2025 in comparison to 1930 for fuel like Nuclear, Solar/Wind and Hydropower. Despite fluctation in usage of these three fuels over years, currently Nuclear is used more than 5 quadtrillion units, Solar/winds us used around 5 quadtrillions unites and hydropower around 4 quadtrillion units. Same quanity is projected to be used in 2030 as well.
Word Count: 184
