Our system will evaluate the answer based on this AI-generated description.
The image shows a line graph with four lines, each representing a different country. The x-axis shows years from 1985 to 2019 at five-year intervals, and the y-axis shows numerical values from 0 to 140 at 20-unit intervals. The line for the USA starts at approximately 40 in 1985 and ends at approximately 120 in 2019, showing a steady increase over time. The UK line starts at approximately 35 in 1985, reaching a value of just over 100 in 2019, also showing a steady increase. Brazil's line begins at approximately 15 in 1985 and ends at roughly 30 in 2019, indicating a slower and less significant growth. India's line starts at approximately 10 in 1985 and ends at just under 40 in 2019, showing a steady but modest increase. The lines do not display any sharp peaks or drops and maintain consistent trajectories throughout the years. The data points on each line are marked by dots.
Given the complexity of the image, the above description may not be entirely accurate.
Skyrocket your IELTS band score by 1-2 points in under a month with our premium plan!
Note: Both the topic and the answer were created by one of our users.
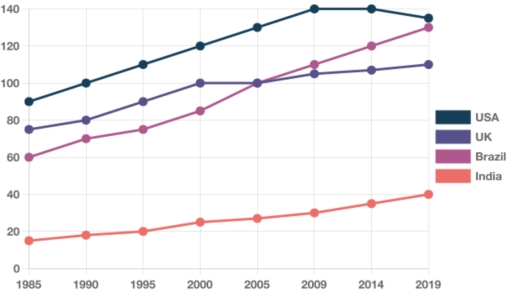
The line graph illustrates the expenditure of meat consumption in four different countries between 1985 and 2019. Overall, all countries was meat consumed an increases in each period, while the USA had the largest percentages to compared to other countires a certain period.
In 1985, the consumption of meat in the USA, started to 90%, with a slight rising to 140% in 2009, while those percentage repidly dipped by 130% at end of the period, which is the highest proportion of meat consumptions to compare in other three countries. The second most popular in the UK, meat consumed to consistently increased in 2000, approximately 100%. After the following year, surpassing the Brazil meat consumption in 2005, it was a slight rise in reached to 110% in the final year.
In contrast, Brazil’s had 60% of meat consumption, while it was significantly climbed to reaching 130% by 2019. Furthermore, India’s meat showed the low, respectively in each period, whereas approximately in 20% to 40%.
Word Count: 163
