Our system will evaluate the answer based on this AI-generated description.
The image depicts a line graph illustrating electricity generation from renewable sources from 2000 to 2020 for USA, Germany, China, Brazil, and India. For USA, percentages are 6% (2000), approximately 6.2% (2002.5), 6.4% (2005), approximately 7% (2007.5), 7.5% (2010), 8% (2012.5), approximately 8.5% (2015), 9% (2017.5), and 9% (2020); for Germany, percentages are 5% (2000), approximately 6.5% (2002.5), 9% (2005), 11% (2007.5), 16% (2010), 21% (2012.5), 30% (2015), 33% (2017.5), and 39% (2020); for China, percentages are approximately 15% (2000), 16.5% (2002.5), 17% (2005), 18% (2007.5), 19% (2010), 20% (2012.5), 23% (2015), approximately 25.5% (2017.5), and 27% (2020); for Brazil, percentages are 80% (2000), approximately 80% (2002.5), 80% (2005), 81% (2007.5), 82% (2010), 83% (2012.5), 81% (2015), approximately 81% (2017.5), and 82% (2020); for India, percentages are 9% (2000), approximately 9.3% (2002.5), 10% (2005), 11% (2007.5), 13% (2010), approximately 14.5% (2012.5), approximately 16.5% (2015), 18% (2017.5), and 22% (2020).
Given the complexity of the image, the above description may not be entirely accurate.
Skyrocket your IELTS band score by 1-2 points in under a month with our premium plan!
Note: Both the topic and the answer were created by one of our users.
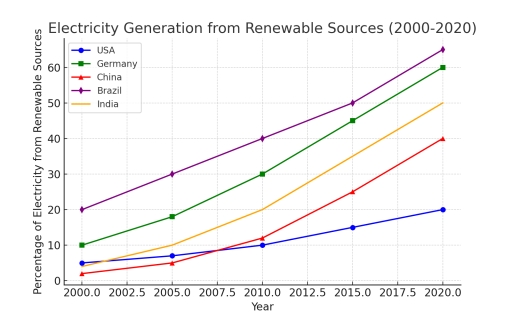
The graph provides information about amplitude of chages in claiming electricity from recycled things from five countries on the 21 years.
Overall, All countries in picture had a growth in making electricity, obviously. Four countries such as USA, Germany, India and China had a similar trajectory of increase. However, the best in this sphere is Brazil.
According the overview, Brazil on the top of chart from the start of the period and on the end have approximately 65%. Next one was Germany which began with 10% and every 3 years increased around 11%. Third one was India, this country start in same number with Usa. While USA had very slow increasing 2.5 to 5% between small periods, India year by year experienced a remarkable increase which account of 15% per 5 years. And the last but not in the list China which was in forth place. On the beginning they were in fifth position, whereas on the end they grew up to 40%.
On the middle of following time, Most of all countries have closed growth which in start and the last years. From 2005, Germany and India become more productive in producing electricity with 30% and 20% and the percentage of growth increased and in subsequent years it grew the same way until the end of the period. China also didn’t fall behind and increased like India, hereby overtaking the United States.
Word Count: 233