🔥 Today Only: Save 30% on Premium — Offer Ends Soon! - Upgrade Now!
Line Graph

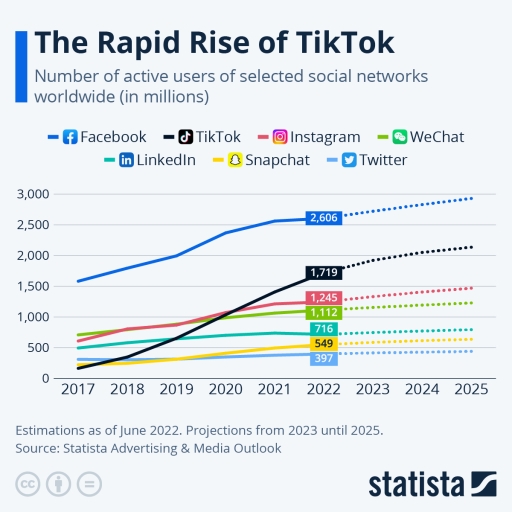
Band 6+: The line graph shows the change in popularity of different social media Summarize the information by selecting and reporting the main features, and make comparisons where relevant.

Image for topic: The line graph shows the change in popularity of different social media Summarize the information by selecting and reporting the main features, and make comparisons where relevant.
Our system will evaluate the answer based on this AI-generated description.
The image shows user data for social networks from 2017 to 2025: Facebook users start just above 2,000 million in 2017, climbing steadily to 2,606 million by 2022. TikTok begins at approximately 0 in 2017, rising sharply to 1,719 million by 2022, with projected growth continuing steeply beyond. Instagram initiates around 700 million in 2017, ascending to 1,245 million by 2022, with moderate projected growth. WeChat starts just above 1,000 million in 2017, reaching 1,112 million by 2022, continuing linearly. LinkedIn, Snapchat, and Twitter start at lower levels: Snapchat begins slightly over 500 million in 2017, growing to 716 million in 2022; Twitter starts near 350 million in 2017, reaching 397 million by 2022; LinkedIn starts around 500 million in 2017, increasing to 549 million in 2022. Projections for all networks are extended to 2025.
Given the complexity of the image, the above description may not be entirely accurate.
Note: Both the topic and the answer were created by one of our users.

The line graph shows how different social media has been increasing during the period from 2017 to 2022.

As we can observe, Facebook has been leading with more than 2500 users. On the contrary, Twitter has the lowest number with 397 of active users . On the other hand, Tik Tok has been increasing rapidly during the period from 2018 to 2022. This data could suggest that perhaps there is a tendency to consume more short videos than sharing content with friends.

On the contrary, the other social networks like Snapchat and WeChat have been showing a small increase from 2018 to 2022.

Finally, we can observe, unlike Facebook and Tik Tok, that there are other apps that haven’t grown, or if they did, their growth has been incipient. This could be due to the lack of publicity, or perhaps, the people who use these apps decided to move out of them and try a more trendy app that could actually fulfill their needs. However, this graph showcases important information on the next move. If used properly, this information can serve to analyze the future behaviour of social media.

Word Count: 189

Answers On The Same Topic:

The line graph shows the change in popularity of different social media Summarize the information by selecting and reporting the main features, and make comparisons where relevant.

The line graph shows how the usage of different social media has increased during the period from 2017 to 2022. As we can observe, Facebook has been leading with more than 2500 users. On the contrary, Twitter has the lowest number, with 397 active users . On the other hand, TikTok has been increasing rapidly […]

The line graph shows the change in popularity of different social media Summarize the information by selecting and reporting the main features, and make comparisons where relevant.

This graph showcases the growing community of social media users. As it can be observed, on the line graph, Facebook leads as the main social media with more than 2,500 millions users. In contrast, Twitter (in 2022) rapidly increased its audience from 2018 to 2025. Looking at the details that are illustrated on the graph, […]

The line graph shows the change in popularity of different social media Summarize the information by selecting and reporting the main features, and make comparisons where relevant.

This graph showcases the growing community of social media users. As it can be seen, facebook retains as the main social media with 2,500 million users in contrasts with Twitter, which in 2022 has not shown a signifcant growth. We can deduce, from this graph, that people still prefere to share pictures and thoughts with […]

The line graph shows the change in popularity of different social media Summarize the information by selecting and reporting the main features, and make comparisons where relevant.

The given line chart illustrate how the user base of different social media applications varied from a year of 2017 to 2025. As it can be seen from the graph, in 2017 there were 1500 millions user used Facebook and the trend of that has gained every year. TikTok has least number of user in […]

See All

Other Topics:

The line graph shows the percentage of people who used three different types of transport (car, bus, and bicycle) to travel to work in a city between 2000 and 2020.

This line chart depicts the proportion of individuals using three modes of commute to travel to work in a city across 20 years. In a glimpse, car usage was significantly higher then that of buses and bicycles across the timeframe, just as cycling recorded the lowest figures. From 2000 to 2020, the ranking of all […]

The graph below gives information about the number of jobs in four sectors of the economy in the US between 1960 and 2020. Summarise the information by selecting and reporting the main features, and make comparisons where relevant.

The line graph illustrates changes in the number of jobs available in four different sectors of the US, which include manufacturing, retail, agriculture, and healthcare, over the period from 1960 to 2020. Overall, it is evident that manufacturing experienced an initial increase before following a downward trend, whereas retail and healthcare followed upward trends. In […]

The graph below shows the price of different kinds of bread in dollars from 2001 to 2005. Compare the trends and write a report.

The line chart provides key information about the cost of five different types of bread in dollars during the period from 2001 to 2005. Overall, it is clear from the graph that wholegrain bread at the beginning of the period got a lower price. However, in the middle of the period the price increased significantly […]

The line graph gives information about the number of Iranian, Greek and Turkish students who enrolled at Sheffield University between 2005 and 2009. Summarize the information by selecting and reporting the main features, and make comparision where relevant.

The line graph illustrates the number of international students from three countries, Iran, Greece and Turkey, who registered at Sheffield University between 2005 and 2009. Overall, it is clear that the number of Greek students decreased significantly throughout the period, while the figures for Iranian and Turkish students increased substantially. In 2005, Greece had the […]

The line graph gives information about the number of Iranian, Greek and Turkish students who enrolled at Sheffield University between 2005 and 2009. Summarize the information by selecting and reporting the main features, and make comparision where relevant.

The line graph illustrates the number of international students from three countries, Iran, Greece and Turkey, who registered at Sheffield University between 2005 and 2009. Overall, it is clear that the number of Greek students decreased significantly throughout the period, while the figures for Iranian and Turkish students increased substantially. In 2005, Greece had the […]

The graph below shows the percentage of people in a European country, by age group, who believed that wearing traditional attire was an important part of their cultural identity between 1990 and 2020.

The line graph illustrates the percentage of people lived in Europe, by five age groups who had a belief that wearing traditional attire had a significant meaning of their cultural identification between 1990 and 2020. Overall, age grops that are older showed higher percentage but gradually declined decade by decade. As for the younger generation […]

See All
We have detected unusual activity on your device.
Please verify your identity to continue.
Note: This verification step won't sign you in. If you have a premium account, please log in to access the service as usual.
Google/Gmail Verification
Or verify using Email/Code
We've sent a verification code to:
youremail@gmail.com (Not your email?)
Enter it below to complete the verification process.
Ensure your email address is correct, your inbox is not full, and you check your spam folder. If no email arrives, consider using an alternative email.
You will need a Premium plan to perform your action!
Note: If you already have a premium account, please log in to access our services as usual.

Plans & Pricing

Our mission is to make quality education accessible for everyone.
However, to keep our hardworking team running and this service alive, we genuinely need your support!
By opting for a premium plan, not only do you sustain us in achieving the mission, but you also unlock advanced features to enrich your learning experience.

Free

For learners who aren't pressed for time

What's included on Free
100+ Cambridge IELTS Tests
Instant IELTS Writing Task 1 & 2 Evaluation (2 times/month)
Instant IELTS Speaking Part 1, 2, & 3 Evaluation (2 times/month)
Instant IELTS Writing Task 1 & 2 Essay Generator (2 times/month)
500+ Dictation & Shadowing Exercises
100+ Pronunciation Exercises
Flashcards
Other Advanced Tools

Premium

For those serious about advancing their English proficiency, and for IELTS candidates aspiring to boost their band score by 1-2 points (especially in writing & speaking) in just 30 days or less

What's included on Premium
Save Your IELTS Test Progress & Analyze Mistakes By Question Type
Save Your Own Flashcard Sets & Use Them On Any Device
Unlock All Courses, IELTS Tests, Section & Part Practice
Unlimited AI Conversations
Unlimited AI Writing Enhancement Exercises
Unlimited IELTS Writing Task 1 & 2 Evaluation
Unlimited IELTS Speaking Part 1, 2, & 3 Evaluation
Checked Answers Will Not Be Published
Unlimited IELTS Writing Task 1 & 2 Essay Generator
Unlimited IELTS Speaking Part 1, 2, & 3 Sample Generator
Unlimited Usage Of Advanced Tools & AI Features
Priority Support within 24h (12-month plan only)

Due to the nature of our service and the provided free trials, payments are non-refundable.