Our system will evaluate the answer based on this AI-generated description.
The image shows user data for social networks from 2017 to 2025: Facebook users start just above 2,000 million in 2017, climbing steadily to 2,606 million by 2022. TikTok begins at approximately 0 in 2017, rising sharply to 1,719 million by 2022, with projected growth continuing steeply beyond. Instagram initiates around 700 million in 2017, ascending to 1,245 million by 2022, with moderate projected growth. WeChat starts just above 1,000 million in 2017, reaching 1,112 million by 2022, continuing linearly. LinkedIn, Snapchat, and Twitter start at lower levels: Snapchat begins slightly over 500 million in 2017, growing to 716 million in 2022; Twitter starts near 350 million in 2017, reaching 397 million by 2022; LinkedIn starts around 500 million in 2017, increasing to 549 million in 2022. Projections for all networks are extended to 2025.
Given the complexity of the image, the above description may not be entirely accurate.
Skyrocket your IELTS band score by 1-2 points in under a month with our premium plan!
Note: Both the topic and the answer were created by one of our users.
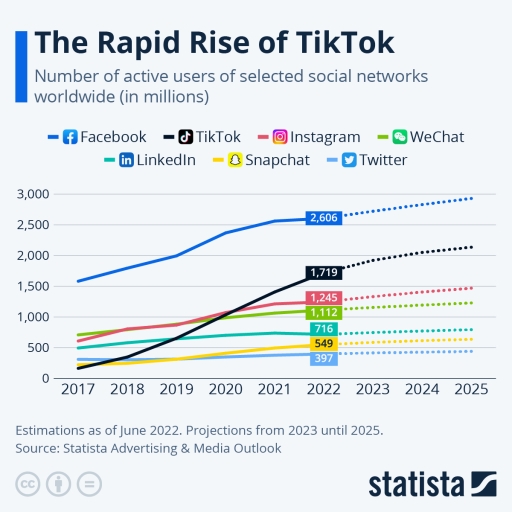
The line graph shows how the usage of different social media has increased during the period from 2017 to 2022.
As we can observe, Facebook has been leading with more than 2500 users. On the contrary, Twitter has the lowest number, with 397 active users . On the other hand, TikTok has been increasing rapidly during the period from 2018 to 2022. This data may suggest that perhaps there is a tendency to consume more short videos than to share content with friends.
On the contrary, other social networks like Snapchat and WeChat have shown a small increase from 2018 to 2022.
Finally, we can observe, unlike Facebook and TikTok, there are other apps that haven’t grown, or if they did, their growth has been incipient. This could be due to the lack of publicity, or perhaps, the people who use these apps decided to move out of them and try a more trendy app that actually fulfills their needs. However, this graph showcases important information on the next move. If used properly, this information can serve to analyze the future behaviour of social media.
Word Count: 185