🔥 Today Only: Save 30% on Premium — Offer Ends Soon! - Upgrade Now!
Map

Band 6+: The maps below show the changes in a town after the construction of a hydroelectric power dam. Summarize the information by selecting and reporting the main features and make comparisons where relevant. You should write at least 150 words.

Image for topic: The maps below show the changes in a town after the construction of a hydroelectric power dam. Summarize the information by selecting and reporting the main features and make comparisons where relevant. You should write at least 150 words.
Our system will evaluate the answer based on this AI-generated description.
The image displays two maps comparing a region in 1990 and 2010. In 1990, features included a river flowing from north to south, flanked by a forest, an ancient structure, rare plants and animals on the left, and mountains, irrigated farmlands, and villages on the right. By 2010, changes are evident: a large lake replaces the river, labeled "Hydroelectric Dam" stretches across the southern part of the lake. The forest and ancient structure have disappeared along with the designation of "Rare plants and animals." In addition, the lake now hosts a boat, and a hotel is situated on the northeast corner near the lake. Villages still remain to the right, but no farmlands are depicted. The map includes a directional compass and an electricity symbol adjacent to the dam, signifying power generation. Mountains appear unchanged. Directions are oriented with north at the top and labeled cardinal points.
Given the complexity of the image, the above description may not be entirely accurate.
Note: Both the topic and the answer were created by one of our users.

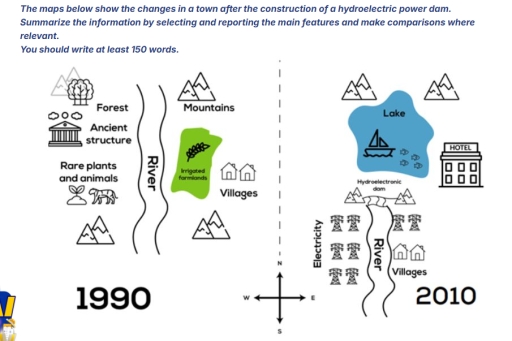
The given maps illustrate the changes in a town after the construction of hydroelectric power dam.

Firstly, in 1990, the west contained many features. Uphill was a forest and an ancient structure. Adjacent to it were rare plants and animals. Downhill were mountains. In the centre was a long river. In the east were also mountains. Below were irrigated farmlands, and next to them were villages. And below were more mountains.

Secondly, in 2010, there were many changes in the town. In the west, mountains and a big lake were added. In comparison with 1990, the forest and ancient structure were removed. In their place, a hydroelectric dam was constructed. The rare plants and animals were transformed into electricity. In the center, the river remained but became smaller. In the east, the mountains remained in their place. The irrigated farmlands and villages were introduced and converted into a hotel. Downhill were electricity and villages.

Overall, in 2010, there were really big changes. A lot of mountains were demolished. In addition, many places were constructed and modernised.

Word Count: 176

Answers On The Same Topic:

The maps below show the changes in a town after the construction of a hydroelectric power dam. Summarize the information by selecting and reporting the main features and make comparisons where relevant. You should write at least 150 words.

The two maps depict the changes in a town after a hydroelectric power dam was built. Overall,the most striking transformation was the removal of rare plants and animals place and the addition of hotel. In 1990,this section of the town was separated by river for two parts:the east side was mostly natural,irrigated farmlands,several villages,mountains and […]

The maps below show the changes in a town after the construction of a hydroelectric power dam. Summarize the information by selecting and reporting the main features and make comparisons where relevant. You should write at least 150 words.

The two maps provides information in relation to the transformation in a town after a hydroelectric power dam was constructed. As is observed, the town witnessed a significant changes, shifting from a rural valley fill with key features like ancient structure, farmland and inhabitant into a place which served recreational activities in addition electricity generated […]

See All

Other Topics:

The maps below shows the layout of a public park in 2010 and the same park now

The maps illustrate the changes in the layout of a public park between 2010 and the present day. Overall, the park has undergone significant redevelopment, with more modern facilities added and the space becoming more functional. While the central structure has been retained, many original features have been replaced by new amenities. In 2010, the […]

The map below shows the site of a school in 2013 and the planned on in 2016

The maps illustrate the site of a school in 2013 and the future plan in 2016. Overall, it is clear that the number of buildings has increased, representing the other facilities have devloped as well. Looking at the maps in more detail, the playground has been replaced into car park two, which is connected to […]

Diagram 1: The plan below shows the changes in the village of Pebbleton 20 years ago and now. (Real Test on May 7 2022, by Cambridge) Summarise the information by selecting and reporting the main features, and make comparisons where relevant.

The diagrams illustrate the change made to layout of Pebbleton over a period of 20 years. Overall, the village has been expanded and new features are added in the present time. Twenty years ago, the village mainly consisted of a ‘lighthouse’ at the top of the beach. There was also a film studio next to […]

The maps below show the changes of a school from 1985 to the present time. Summarize the information by selecting and reporting the main features and make comparisons where relevant

This is a map which shows how a school has changed over the course of the years going from 1985 comparing to how it is today. The biggest change has been the size of the playing field. If we compare it today with how it was in the year 1985 we can notice how it […]

"You should spend about 20 minutes on this task. The maps show changes that took place in Youngsville in New Zealand over a 25 year period from 1980 to 2005 Summarise the information by selecting and reporting the main features, and make comparisons where relevant. You should write at least 150 words."

The maps illustrate the changes that occurred in Youngsville, New Zealand, over a 25-year period from 1980 to 2005. Overall, the town underwent significant development during this time, becoming more urbanized with the construction of new commercial, industrial, and recreational facilities. Natural areas were reduced, while modern infrastructure increased, particularly in the eastern and southern […]

The diagram below show the changes that has taken place in a village park.

The diagrams illustrate the transformations that have occurred in a village park over the past decade. Overall, the village park has undergone substantial enhancements, resulting in increased amenities and recreational opportunities for the community. Ten years ago, the park featured two tennis courts in the upper left corner, a single children’s play area adjacent to […]

See All
We have detected unusual activity on your device.
Please verify your identity to continue.
Note: This verification step won't sign you in. If you have a premium account, please log in to access the service as usual.
Google/Gmail Verification
Or verify using Email/Code
We've sent a verification code to:
youremail@gmail.com (Not your email?)
Enter it below to complete the verification process.
Ensure your email address is correct, your inbox is not full, and you check your spam folder. If no email arrives, consider using an alternative email.
You will need a Premium plan to perform your action!
Note: If you already have a premium account, please log in to access our services as usual.

Plans & Pricing

Our mission is to make quality education accessible for everyone.
However, to keep our hardworking team running and this service alive, we genuinely need your support!
By opting for a premium plan, not only do you sustain us in achieving the mission, but you also unlock advanced features to enrich your learning experience.

Free

For learners who aren't pressed for time

What's included on Free
100+ Cambridge IELTS Tests
Instant IELTS Writing Task 1 & 2 Evaluation (2 times/month)
Instant IELTS Speaking Part 1, 2, & 3 Evaluation (5 times/month)
Instant IELTS Writing Task 1 & 2 Essay Generator (2 times/month)
500+ Dictation & Shadowing Exercises
100+ Pronunciation Exercises
Flashcards
Other Advanced Tools

Premium

For those serious about advancing their English proficiency, and for IELTS candidates aspiring to boost their band score by 1-2 points (especially in writing & speaking) in just 30 days or less

What's included on Premium
Save Your IELTS Test Progress
Unlock All Courses & IELTS Tests
Unlimited AI Conversations
Unlimited AI Writing Enhancement Exercises
Unlimited IELTS Writing Task 1 & 2 Evaluation
Unlimited IELTS Speaking Part 1, 2, & 3 Evaluation
Checked Answers Will Not Be Published
Unlimited IELTS Writing Task 1 & 2 Essay Generator
Unlimited IELTS Speaking Part 1, 2, & 3 Sample Generator
Unlimited Usage Of Advanced Tools
Priority Support within 24h (12-month plan only)

Due to the nature of our service and the provided free trials, payments are non-refundable.
Nếu bạn là người Việt Nam và không có hoặc không muốn trả bằng credit/debit cards, bạn có thể thanh toán bằng phương thức chuyển khoản:


Chọn gói:
419,000₫ 277,000 ₫ cho gói 1 tháng (chỉ 9,233₫/ngày)
1,239,000₫ 597,000 ₫ cho gói 3 tháng (chỉ 6,633₫/ngày)
2,469,000₫ 1,027,000 ₫ cho gói 6 tháng (chỉ 5,706₫/ngày)
4,929,000₫ 1,417,000 ₫ cho gói 12 tháng (chỉ 3,936₫/ngày)


Sau khi chuyển khoản, vui lòng đợi trình duyệt tự động điều hướng bạn trở lại Engnovate và bạn sẽ ngay lập tức nhận được mã kích hoạt tài khoản premium.
Nếu có lỗi xảy ra, bạn có thể liên hệ với team thông qua một trong các phương thức: email đến helloengnovate@gmail.com hoặc nhắn tin qua facebook.com/engnovate.
Vì toàn bộ công cụ trên website đều có thể sử dụng thử miễn phí, Engnovate không hỗ trợ hoàn tiền.