Our system will evaluate the answer based on this AI-generated description.
The image displays a line graph comparing the use of renewable energy from 1971 to 2006 in six countries: Finland, Denmark, Germany, United States, France, and United Kingdom. The y-axis represents the percentage use of renewable energy ranging from 0 to 25%, while the x-axis covers selected years from 1971 to 2011 (1971, 1976, 1981, 1986, 1991, 1996, 2001, 2006, 2011). The lines fluctuate as follows: Finland starts near 15% in 1971, peaks around 25% in 1996, then slightly declines to just below 25% in 2006. Denmark begins slightly above 5% in 1971, shows a rising trend to nearly 20% by 2006. Germany starts at around 5%, gradually increases to approximately 10% by 2006. The US stays consistently around 5% throughout the entire period. France begins near 10% in 1971, decreases to about 5% in 1981, then remains stable through to 2006. The UK line remains consistently around 0%-2% from 1971 to 2006.
Given the complexity of the image, the above description may not be entirely accurate.
Skyrocket your IELTS band score by 1-2 points in under a month with our premium plan!
Note: Both the topic and the answer were created by one of our users.
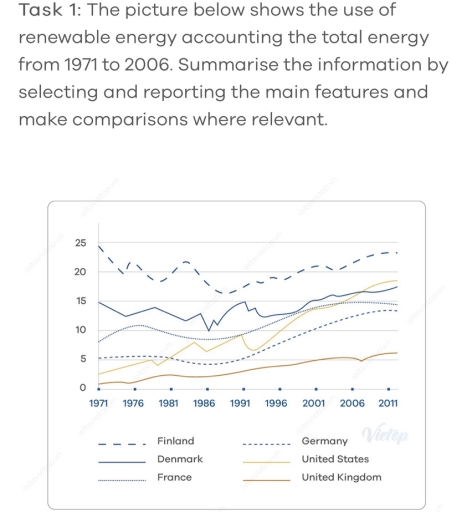
The line chart demonstrates the use of renewable energy represented the entire amount energy from 1971 and 2006.
Overall, there are large proportion of use of renewable energy represented in six state. There was a decline in Finland, despite that, Finland kept the high position in throughout the year.
Looking at higher figures, there are three country such as, Finland, Denmark and united states. Finland exhibited mild fluctuation reached mere 25% in 1971but, this trend dropped at 23%. Denmark represented second highest figure at 15% in initially year, following years this trend was decline at 10% but it recovered roughly 16 %. Meanwhile, The United States reached almost lowest level at 3% in 1971, after which it experienced a dramatically rose at 18 % in 2011.
In contrast, France and Germany recorded merely similarly patters. In 1976, France was increased approximately 11% and this share was steeply growth in last years, following nearly by Germany started at 5%, and peaked up 13%. Furthermore, United Kingdom accounted for rose moderately from 1% to 6 %. Respectively.
Word Count: 175
