24 Hours Only: Get 39% OFF on Our Premium Plan - Check Out Now!
Map

Band 5+: The picture illustrate some changes in a particular area with three different times.

Image for topic: The picture illustrate some changes in a particular area with three different times.
Our system will evaluate the answer based on this AI-generated description.
The image contains three maps depicting the layout changes of a region across the years 1800, 1900, and 2000. In 1800, the region includes Farmland (Crops) in the northeast, Woodland in the north, River Stour running horizontally with Farmland (Animals) south of it, and Brindell located in the southwest. In 1900, Farmland (Crops) areas are reduced and shifted to the far east, Woodland occupies less area in the north, River Stour flows as before, and new additions include Industry in the southeast and a Village for Workers with Bun Hill around it in the eastern region. By 2000, Farmland (Crops) remains to the east, Woodland is in a small northern section, a new Park appears adjacent to Woodland, River Stour maintains its path, Industry grows larger in the southeast, the Village for Workers with Bun Hill remains, and Brindell stays in the southwest.
Given the complexity of the image, the above description may not be entirely accurate.
Note: Both the topic and the answer were created by one of our users.

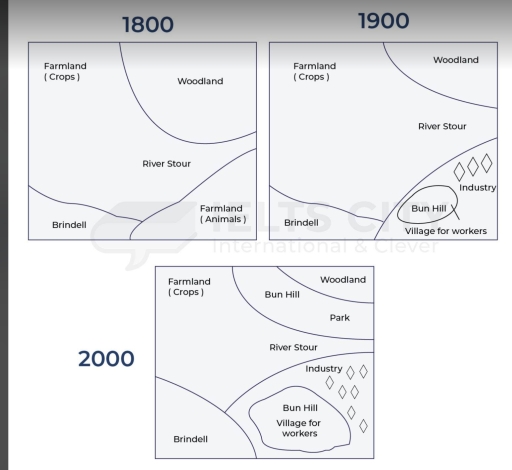
This diagram shows a development of a specific regions in varios centuries.

Overall, the area of crops farmland, brindell and woodland has change to some extent, but still they are a part of map in all of these centuries, while animals farmland completely replaced with bun hill, village for worker and industry.

In 18th century, larg part of region was occupied by crops farmland. Animal farmland and woodland almost covered equal part of region in this era while brindell has only small portion as compared to other. In 1900 the area of woodland was transfored into crops farmland as result of this it is increased, but brindall remained almost untouched. Moreover, animal farmland was completly converted into three new parts industry, burhill and village for workers.

In 20th century, some part of farmland was taken by other region in order to modify and increase their area, like number of industry increased, bun hill park were made in front of woodland, and increase the area of workers village and brindell.

Word Count: 169

Answers On The Same Topic:

The picture illustrate some changes in a particular area with three different times.

The diagrams illustrate how a particular region evolved over three distinct periods: 1800, 1900, and 2000. Overall, while the areas of farmland for crops, woodland, and Brindell remained present throughout the three periods, the farmland for animals was completely replaced by industrial and residential developments. Additionally, the region experienced significant urbanization and the introduction of […]

The picture illustrate some changes in a particular area with three different times.

The picture demonstrates how an area changed in three years: 1800, 1900 and 2000. Overall, it is clear that during the period of modernization, the woodland was replaced by parks and Bun Hill. Meanwhile, farmland, which was the largest area, decreased in size. Regarding the two maps in 1800 and 1900, it can be seen […]

The picture illustrate some changes in a particular area with three different times.

The map illustrates the changes in a specific area over three centuries , starting from the 19th century. Overall, the place undergoes a massive transformation throughout the period .Woodland area is demolished little over the time ,whereas, the farlands for the animals was completely wiped fro the map. Firstly, the farmlands dedicated for thr crops […]

The picture illustrate some changes in a particular area with three different times.

The diagrams illustrate how a particular region changed in the years 1800, 1900, and 2000. Overall, while the areas of farmland for crops, woodland, and Brindell remained throughout the three periods, the farmland for animals was completely replaced by industrial and residential development. In 1800, most of the region consisted of farmland for crops, while […]

See All

Other Topics:

The plan below shows the emergency evacuation arrangements in Gillespie Neuroscience Research Facility. Summarise the information by selecting and reporting the main features, and make comparisions where relevent.

The graphical diagram illustrates a straightforward plan to evacuate people from the basement of Gillespie Neuroscience Research Facility in times of emergency. Overall, this plan is designed to make it easily understandable for the general public. This design plan includes the locations of two stairways, three routes of exit, an elevator, and the exact positions […]

The plan below shows the emergency evacuation arrangements in Gillespie Neuroscience Research Facility. Summarise the information by selecting and reporting the main features, and make comparisions where relevent.

The diagram illustrates the exit points in case of emergency in Gillespie Neuroscience Research Facility. Overall, there are two exits through stairs, and one direct exit, while elevator can be also used to reach the bottom floor. In case of emergency, there are some extinguisher and fire alarms. Two exit routes are with stairs so […]

The plans below show a studdent accommodation building on 2010 and now

The two maps illustrate the the layout of student accommodation building between 2010 and present. Overall, the student accommodation building has undergone moderate reorganization rather than complete redevelopment. While several gardens and livingroom have been repurposed, other facilities have remained in their positions. In 2010, the northern section of the building contained garden, livingroom and […]

The mapsbelow show the transformation of the areal around tumbletown between 1995 anda 2010

The illustration describes the changes occured in a zone around Tumbledown from 1995 to 2010. Overall, the great amount of facilities have been expanded and gradually changed their purposes for absolutely new ones. Noticable transformations also include reduction of provided place for flora and wider focus on science related amenities. In 1995, farmland was the […]

The Diagrams below show a small local museum and its surroundings in 1957 and 2007 summarize the information by selecting main features etc.

The given diagrams illustrate a small local museum and its surroundings 1857 and 2007. Firstly, in 1957 upstairs was a lot of different trees and garden. In the centre of was premises. The premises had 3 rooms. The biggest was national history exhibition and next to local history room and museum store-room. Downstairs was road […]

The plans show an office in a university in 2005 and the same office now.

The map shows office and the changes it has experienced from 2005 to the present time. Overall, the office has changed a lot compared to 2005. There are fewer individual desks now, and more space has been used for group work and relaxation. In addition, some new equipment and facilities have been added, making the […]

See All
We have detected unusual activity on your device.
Please verify your identity to continue.
Note: This verification step won't sign you in. If you have a premium account, please log in to access the service as usual.
Google/Gmail Verification
Or verify using Email/Code
We've sent a verification code to:
youremail@gmail.com (Not your email?)
Enter it below to complete the verification process.
Ensure your email address is correct, your inbox is not full, and you check your spam folder. If no email arrives, consider using an alternative email.
You will need a Premium plan to perform your action!
Note: If you already have a premium account, please log in to access our services as usual.

Plans & Pricing

Our mission is to make quality education accessible and free for everyone.
However, to keep our hardworking team running and this service alive, we genuinely need your support!
By opting for a premium plan, not only do you sustain us in achieving the mission, but you also unlock advanced features to enrich your learning experience.

Free

For learners who aren't pressed for time

What's included on Free
1000+ IELTS Tests & Samples
Instant IELTS Writing Task 1 & 2 Evaluation (2 times/month)
Instant IELTS Speaking Part 1, 2, & 3 Evaluation (5 times/month)
Instant IELTS Writing Task 1 & 2 Essay Generator (2 times/month)
500+ Dictation & Shadowing Exercises
100+ Pronunciation Exercises
Flashcards
Other Advanced Tools

Premium

For those serious about advancing their English proficiency, and for IELTS candidates aspiring to boost their band score by 1-2 points (especially in writing & speaking) in just 30 days or less

What's included on Premium
Save Your IELTS Test Progress
Unlock All Courses & Content
Unlimited AI Conversations
Unlimited AI Writing Enhancement Exercises
Unlimited IELTS Writing Task 1 & 2 Evaluation
Unlimited IELTS Speaking Part 1, 2, & 3 Evaluation
Checked Answers Will Not Be Published
Unlimited IELTS Writing Task 1 & 2 Essay Generator
Unlimited IELTS Speaking Part 1, 2, & 3 Sample Generator
Unlimited Usage Of Advanced Tools

Due to the nature of our service and the provided free trials, payments are non-refundable.
Nếu bạn là người Việt Nam và không có hoặc không muốn trả bằng credit/debit cards, bạn có thể thanh toán bằng phương thức chuyển khoản:


Chọn gói:
279,000₫ 157,000 ₫ cho gói 1 tháng (chỉ 5,233₫/ngày)
819,000₫ 397,000 ₫ cho gói 3 tháng (chỉ 4,411₫/ngày)
1,649,000₫ 667,000 ₫ cho gói 6 tháng (chỉ 3,706₫/ngày)
3,299,000₫ 857,000 ₫ cho gói 12 tháng (chỉ 2,381₫/ngày)


Sau khi chuyển khoản, vui lòng đợi trình duyệt tự động điều hướng bạn trở lại Engnovate và bạn sẽ ngay lập tức nhận được mã kích hoạt tài khoản premium.
Nếu có lỗi xảy ra, bạn có thể liên hệ với team thông qua một trong các phương thức: email đến helloengnovate@gmail.com hoặc nhắn tin qua facebook.com/engnovate.
Vì toàn bộ công cụ trên website đều có thể sử dụng thử miễn phí, Engnovate không hỗ trợ hoàn tiền.