Our system will evaluate the answer based on this AI-generated description.
The image presents a pie chart titled 'The pie chart shows the energy use in Australian homes in 2008' and an accompanying outline. The chart, subtitled 'Energy use in Australian homes in 2008', shows percentages of energy use for various purposes: Heating & cooling 38%, Water heating 25%, Other appliances 16%, Lighting 7%, Fridges & freezers 7%, Cooking 4%, and Stand-by power 3%. The outline is structured as follows: 1) Intro: energy use = how much electricity was used for different purposes, Australian homes = Australian households. 2) Overview: Heating and cooling accounted for majority of energy use. 3) Body 1 (Heating & cooling, water heating, and other appliances -- three biggest): highest energy consumption = heating & cooling (+data), the figure for water heating = slightly lower (data), Other appliances = at third place (data). 4) Body 2 (Modern methods): Lighting + Fridges & Freezers: similar amount of energy (+data), Cooking + stand-by power: negligible proportion of total energy used (data).
Given the complexity of the image, the above description may not be entirely accurate.
Skyrocket your IELTS band score by 1-2 points in under a month with our premium plan!
Note: Both the topic and the answer were created by one of our users.
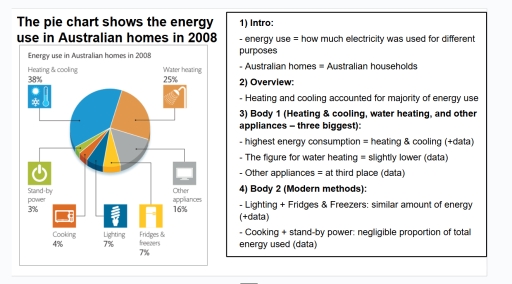
The pie chart illustrates the proportions of energy consumed for various purposes in Australian households in the year 2008.
Overall, it is clear that heating and cooling, along with water heating, accounted for the vast majority of domestic energy usage. In contrast, cooking and stand-by power represented a negligible proportion of the total energy consumed.
Looking at the three largest categories of energy consumption, heating and cooling was the primary driver of energy use, accounting for the highest share at 38%. Water heating followed closely behind as the second most significant sector, making up exactly a quarter (25%) of the total. Other appliances sat in third place, responsible for 16% of the household energy budget.
Turning to more modern methods and minor uses, lighting as well as fridges and freezers consumed a similar amount of energy, each standing at 7%. Finally, the smallest fractions of energy were dedicated to cooking at 4%, and stand-by power, which consumed a minimal 3% of the total household energy.
Word Count: 165