Our system will evaluate the answer based on this AI-generated description.
The image consists of six pie charts comparing the methods used by international students to book online English courses in three different countries (Australia, the USA, and Canada) in 2009 and 2010. The charts show the percentage breakdown of four booking methods: Arrival, Pre-booked with agents, Internet, and Other. In Australia, in 2009, 70% of students booked on arrival, 10% pre-booked with agents, 10% used the internet, and 10% used other methods. In 2010, those percentages changed to 50%, 30%, 10%, and 10%, respectively. In the USA, in 2009, 50% booked on arrival, 30% pre-booked with agents, 10% used the internet, and 10% used other methods. In 2010, those percentages changed to 60%, 20%, 10%, and 10%, respectively. In Canada, in 2009, 40% booked on arrival, 40% pre-booked with agents, 10% used the internet, and 10% used other methods. In 2010, those percentages changed to 30%, 50%, 10%, and 10%, respectively.
Given the complexity of the image, the above description may not be entirely accurate.
Skyrocket your IELTS band score by 1-2 points in under a month with our premium plan!
Note: Both the topic and the answer were created by one of our users.
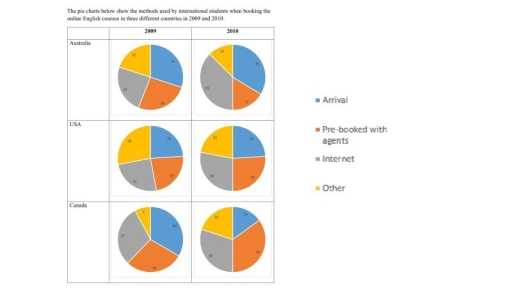
The pie charts demonstrate how international students booked the online English courses in Australia, the USA and Canada in 2009 and 2010.
Looking from an overall perspective, it is readily apparent that the proportions of students booking the online courses increased in all three countries, while the 3 remaining categories varied by years and by countries.
The figures of booking the courses via the Internet had grown from 24 to 39 in Australia by 2010, in the USA and Canada the percentage had increased by 3, having 28% and 30% respectively at the end of the period. These data accounted for the largest share in all three countries.
The most noticeable changes had been undertaken/made in Canada. The percentage of those who preferred the booking-on-arrival method had halved by 2010 with 15%, whereas booking through agents and other methods began to be used more frequently, at 35% and 20% respectively. It is noteworthy that in 2010, the agent pre-booking method prevailed over the online method.
Word Count: 165