🔥 Today Only: Save 30% on Premium — Offer Ends Soon! - Upgrade Now!
Pie Chart

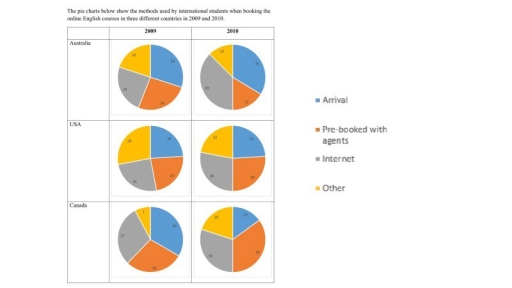
Band 5+: The pie charts below show the methods used by international students when booking the online English courses in three different countries in 2009 and 2010. Summarise the information by selecting and reporting the main features, and make comparisons where relevant.

Image for topic: The pie charts below show the methods used by international students when booking the online English courses in three different countries in 2009 and 2010. Summarise the information by selecting and reporting the main features, and make comparisons where relevant.
Our system will evaluate the answer based on this AI-generated description.
The image consists of six pie charts comparing the methods used by international students to book online English courses in three different countries (Australia, the USA, and Canada) in 2009 and 2010. The charts show the percentage breakdown of four booking methods: Arrival, Pre-booked with agents, Internet, and Other. In Australia, in 2009, 70% of students booked on arrival, 10% pre-booked with agents, 10% used the internet, and 10% used other methods. In 2010, those percentages changed to 50%, 30%, 10%, and 10%, respectively. In the USA, in 2009, 50% booked on arrival, 30% pre-booked with agents, 10% used the internet, and 10% used other methods. In 2010, those percentages changed to 60%, 20%, 10%, and 10%, respectively. In Canada, in 2009, 40% booked on arrival, 40% pre-booked with agents, 10% used the internet, and 10% used other methods. In 2010, those percentages changed to 30%, 50%, 10%, and 10%, respectively.
Given the complexity of the image, the above description may not be entirely accurate.
Note: Both the topic and the answer were created by one of our users.

The provided pie charts compare the ways utilize by international students when booking English course. According to these charts, there are three nations which is Australia, the United State of America, and Canada between the years 2009 and 2010.

Overall, what stands out from these charts is that Canada during 2009 achieved the highest percentage in arrival, while it scored the lowest one in other which was 6% at the same year.

To begin, in 2009, whilst Canada peaked the highest figures which were 45% in arrival online course, the USA and Australia reached 24% and 26%, approximately. In addition, the student who booked from the internet, these percentages was nearly at the same which were 24%, 26%, and 27%, respectively. Also peers who pre-booked with agents scored 27%, 24%, and 22%, successively.

Turning to 2010, the student who reserved internet registered 39%, 25%, and 25%, reversely in Australia, the USA, and Canada. Whereas, these three countries hit 11%, 28%, and 35%, respectively, for people who pre-booked with agents, which these proportions increased in the order.

Word Count: 176

Answers On The Same Topic:

The pie charts below show the methods used by international students when booking the online English courses in three different countries in 2009 and 2010. Summarise the information by selecting and reporting the main features, and make comparisons where relevant.

The pie chart below illustrates the methods used by different students when reserving online English courses across three countries in 2009 and 2010. Overall, it can be seen that in Australia was dominance in internet booking while in USA it experience the opposite trend, showing the similar results in both 2009 and 2010 and student’s […]

The pie charts below show the methods used by international students when booking the online English courses in three different countries in 2009 and 2010. Summarise the information by selecting and reporting the main features, and make comparisons where relevant.

The pie chart below illustrates the methods used by different students when reserving online English courses across three countries in 2009 and 2010. Overall, it can be seen that in Australia was dominance in internet booking while in USA it experience the opposite trend, showing the similar results in both 2009 and 2010 and student’s […]

The pie charts below show the methods used by international students when booking the online English courses in three different countries in 2009 and 2010. Summarise the information by selecting and reporting the main features, and make comparisons where relevant.

The given pie chart provides a detailed comparison of how overseas learners booked online english learning courses in three different countries spanning two years. Overall, it is evident from the chart that Canadian arrival student initially held the largest proportion, which declined after a year later, While Australian student showed notably growth in arrival, and […]

The pie charts below show the methods used by international students when booking the online English courses in three different countries in 2009 and 2010. Summarise the information by selecting and reporting the main features, and make comparisons where relevant.

The given pie charts illustrate the approaches used by overseas students to reserve online courses in Australia, the USA, and Canada over two years: 2009 and 2010. It is obvious that the proportion of students booking online courses rose in three countries throughout the tracking period, while the three means of reserving courses varied by […]

The pie charts below show the methods used by international students when booking the online English courses in three different countries in 2009 and 2010. Summarise the information by selecting and reporting the main features, and make comparisons where relevant.

The pie charts demonstrate how international students booked the online English courses in Australia, the USA and Canada in 2009 and 2010. Looking from an overall perspective, it is readily apparent that the proportions of students booking the online courses increased in all three countries throughout the whole period, while the three remaining categories varied […]

See All

Other Topics:

The pie charts below show the percentage of US music album sales by genre in 2008, 2009, and 2010. Summarise the information by selecting and reporting the main features, and make comparisons where relevant.

The pie charts illustrate the percentage US music album sales by different genre between 2008, 2009 and 2010. Overall, rock music accounted for the largest proportion over the period while jazz music was the smallest. In addition, while R&B and alternative music were declined, country music saw a rise. The figure for rock music started […]

The pie chart below shows the main reasons why agricultural land become lesson productive. The table shows how these causes affected three regions of the world during the 1990s.

The pie chart illustrates the primary reasons why agricultural land became less productive, while the table indicates how these factors affected three different regions of the world during the 1990s. Overall, over-grazing made up by far the largest share of the total land degradation worldwide. As regards the regions, Europe experienced the highest percentage of […]

The pie charts show figures for the use of public libraries in 1991 and 2000 in Britain. Summarise the information by selecting and reporting the main features, and make comparisons where relevant.

The pie charts illustrates the propotion of the number of visitors of public libraries in sevral categories in britain in 1991 and 2000. Overall, the number of visitors rose from 290 million in 1991 to 350 visitors in 2000 .It is noticeable that the category of visitors who browed or returned books was emerged as […]

The pie charts below show the percentage of household income spent on five categories in a country in 2000 and 2020.

The pie chart presents a comparison on how households divide their monthly spending among five distinct categories between 2000 and 2020. Overall, in 2000 the highest percentage of spending was on food, while in 2020 housing had the most monthly spendings. The lowest figure in 2010 was savings and in 2020 it was the same […]

The charts show changes in the proportion of energy produced from different resources in a country in 1985 and 2003.

The pie charts illustrate the percentage of energy generated by various resources in a particular country from 1985 to 2003. Overall, while the figures for natural gas, coal and other renewable energy sources followed an upward trajectory, the opposite was true for oil and nuclear. Notably, the proportion of Oil recorded the highest share whereas […]

The two charts below show the proportion of qualified graduates in a particular country. To summarize information by selecting key characteristics and compiling a report and, if necessary, make a comparison. Đề 6: The diagram shows how tea leaves are processed into five tea types.

The two pie charts compare the proportional allocation of qualified graduates across six multiple categories in a particular nation in from 1980 to 2008. At a broader level,the data exhibits a marked transformation in the distribution of academic qualifictions,characterised by a substantial increase in phD graduates in Science,coupled with a discernible decline in first-degree educational […]

See All
We have detected unusual activity on your device.
Please verify your identity to continue.
Note: This verification step won't sign you in. If you have a premium account, please log in to access the service as usual.
Google/Gmail Verification
Or verify using Email/Code
We've sent a verification code to:
youremail@gmail.com (Not your email?)
Enter it below to complete the verification process.
Ensure your email address is correct, your inbox is not full, and you check your spam folder. If no email arrives, consider using an alternative email.
You will need a Premium plan to perform your action!
Note: If you already have a premium account, please log in to access our services as usual.

Plans & Pricing

Our mission is to make quality education accessible for everyone.
However, to keep our hardworking team running and this service alive, we genuinely need your support!
By opting for a premium plan, not only do you sustain us in achieving the mission, but you also unlock advanced features to enrich your learning experience.

Free

For learners who aren't pressed for time

What's included on Free
100+ Cambridge IELTS Tests
Instant IELTS Writing Task 1 & 2 Evaluation (2 times/month)
Instant IELTS Speaking Part 1, 2, & 3 Evaluation (2 times/month)
Instant IELTS Writing Task 1 & 2 Essay Generator (2 times/month)
500+ Dictation & Shadowing Exercises
100+ Pronunciation Exercises
Flashcards
Other Advanced Tools

Premium

For those serious about advancing their English proficiency, and for IELTS candidates aspiring to boost their band score by 1-2 points (especially in writing & speaking) in just 30 days or less

What's included on Premium
Save Your IELTS Test Progress & Analyze Mistakes By Question Type
Save Your Own Flashcard Sets & Use Them On Any Device
Unlock All Courses, IELTS Tests, Section & Part Practice
Unlimited AI Conversations
Unlimited AI Writing Enhancement Exercises
Unlimited IELTS Writing Task 1 & 2 Evaluation
Unlimited IELTS Speaking Part 1, 2, & 3 Evaluation
Checked Answers Will Not Be Published
Unlimited IELTS Writing Task 1 & 2 Essay Generator
Unlimited IELTS Speaking Part 1, 2, & 3 Sample Generator
Unlimited Usage Of Advanced Tools & AI Features
Priority Support within 24h (12-month plan only)

Due to the nature of our service and the provided free trials, payments are non-refundable.