24 Hours Only: Get 39% OFF on Our Premium Plan - Check Out Now!
Table

Band 5+: the table below gives information about the changes in the military budgets of 8 countries between 2004 and 2020

Image for topic: the table below gives information about the changes in the military budgets of 8 countries between 2004 and 2020
Our system will evaluate the answer based on this AI-generated description.
The image presents a table comparing military budgets across eight countries for years 2004 and 2020. In 2004, budgets were: United States $623bn, China $65bn, Russia $50bn, France $45bn, United Kingdom $42.8bn, Japan $41.2bn, Germany $35bn, Italy $28.2bn, totaling $930.2bn. In 2020, budgets shifted to: United States $778bn, China $178bn, Russia $61.7bn, France $48.3bn, United Kingdom $41.5bn, Japan $51.9bn, Germany $51.4bn, Italy $15bn, totaling $1,125.8bn. Germany and Japan both increased to $51.9bn and $51.4bn, respectively, while Italy displayed a decrease to $15bn from $28.2bn. Russia and France saw minor changes with Russia at $61.7bn and France at $48.3bn. The United States and China recorded the highest budgets in both years, with China rising to $178bn and the U.S. to $778bn. The total budget increased by $195.6bn from $930.2bn in 2004 to $1,125.8bn in 2020.
Given the complexity of the image, the above description may not be entirely accurate.
Note: Both the topic and the answer were created by one of our users.

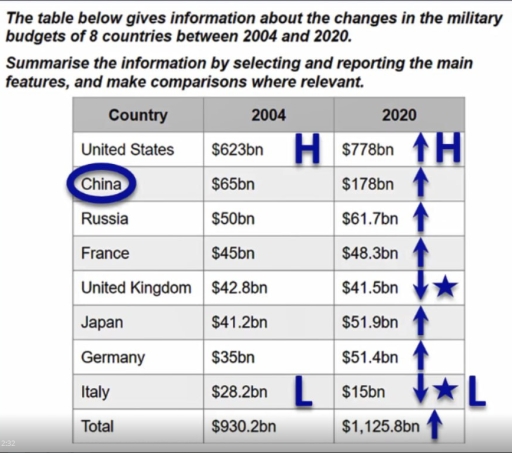
The taple illustrates, information about the fluctuation in the military budgets of eight countries between 2004 and 2020,

overall, the United States constantly witnessed the haighst statistics in both of the years 2004 and 2020, while China outperforming the other countries except the United States, in contrast Russia, France, Japan, Germany increase thier military budgets, conversely, the United Kingdom and Italy; underwent thier domain to diminish,

beginning with The United States, they increase their finance from $623bn to $778bn this significantly surpasses other statistics, on the other hand China budgets rebounding from $65bn in 2004 to $178bn in 2024, Russa also increased thier military budget around $11.7 bn, Fance put up with $3,3bn, Japan boost their faild as well nearly $11bn, Germany doubled the funding from $35bn to $51.4bn,

another trend that can be observed is that, The United Kingdom show a minor variation in thier finance around $1.3, as for Italy it can be seen a remakable decline compared in their budget in 2004.

Word Count: 165

Answers On The Same Topic:

the table below gives information about the changes in the military budgets of 8 countries between 2004 and 2020

The provided table shows the amount of military budgets and its fluctuations in 8 different nations from 2004 to 2020. Overall, the USA had the highest budget throughout the period, while Italy stayed in the bottom. Mostly, the military budgets increased between 16-years gap. The USA which had the highest budget, rose from 623 to […]

the table below gives information about the changes in the military budgets of 8 countries between 2004 and 2020

This image illustrate the milatry budget changing information of 8 countries from 2004 to 2020 in a corsoury glance there are 8 countries in this diagram and there budget as we clearly see almost every country increase their milatry budget as compare to past in 2004 in 2004 all contries have a large ammount of […]

the table below gives information about the changes in the military budgets of 8 countries between 2004 and 2020

The table given above provides information on changes in military budgets in 2004 and 2020 for eight different countries. Overall, it can generally be seen that there has been a surge in the accumulated military budget for all eight countries, with the United States having the largest military budget and Italy having the smallest. Most […]

the table below gives information about the changes in the military budgets of 8 countries between 2004 and 2020

This table illustrates military investments in billion dollars among 8 different countries between 2004 and 2020. Overall, the US was always ahead of the ranking and even increased its budget, whilst Italy decreased dramatically. Moreover, China is the country that peaked the most in terms of investments, whereas the UK’s output dropped there. Not only […]

See All

Other Topics:

The chart below shows the primary hobbies of the adult residents in a small towm.

The chart gives information about the main hobbies of adults living in a small Tunisian town. Overall, watching TV and movies became increasingly popular over time, while activities such as gardening and playing video games declined. Meanwhile, playing music remained stable throughout the period. In 1980, all hobbies had the same figures at about 100. […]

The chart below shows the primary hobbies of the adult residents in a small towm.

The given bar chart illustrates the primary leisure activities of adult dwellers in a small Tunisian town from 1980 to 2020. Overall, it is clear that while the figure for individuals engaging in reading books, TV and movies, and working out witnessed an upward trend throughout the period, the opposite was true for baking, gardening […]

The table below gives information about some of the world's most studied languages. Summarise the information by selecting and reporting the main features, and make comparisons where relevant.

Overall, except for Chinese which has the largest native-speaking population, English dominates in both the number of learners and the total number of countries where it is spoken. Whereas most listed languages have significantly more native speakers than students, English stands out as the only one where the number of people learning the language far […]

Summarize the information about metro systems in six different cities

The given table illustrates the information of metro systems in six different regions. Overall, it is clearly seen that the New York City Subway is the most extensive system, while Beijing has the most passengers annually. Additionally, there is a huge difference in ticket costs. London is the most expensive and Mexico City is the […]

The students very good response rating to the resources provided by the college,for three courses

The graph represents the proportion of students who expressed a high level of satisfaction with services rendered, for three courses. Overall, commerce students were satisfied the most, especially in terms of pre-couse information and teaching, while the reverse is true for law students, which have the lowest contemnment rating. In detail, students with a major […]

The table illustrate proportion of people participating in leisure activities by three selected age groups.

The table illustrates the percentage of individuals in 16-19, 25-29, and 60-69 age groups ,taking part in sevent different hobbies. Overall, watching TV or DVDs recorded the highest figure among all age groups, while dressmaking/needlework/knitting remained the lowest share. Looking into detail, all three groups participated in watching TV at 99%, which was dominant. Visiting/ […]

See All
We have detected unusual activity on your device.
Please verify your identity to continue.
Note: This verification step won't sign you in. If you have a premium account, please log in to access the service as usual.
Google/Gmail Verification
Or verify using Email/Code
We've sent a verification code to:
youremail@gmail.com (Not your email?)
Enter it below to complete the verification process.
Ensure your email address is correct, your inbox is not full, and you check your spam folder. If no email arrives, consider using an alternative email.
You will need a Premium plan to perform your action!
Note: If you already have a premium account, please log in to access our services as usual.

Plans & Pricing

Our mission is to make quality education accessible and free for everyone.
However, to keep our hardworking team running and this service alive, we genuinely need your support!
By opting for a premium plan, not only do you sustain us in achieving the mission, but you also unlock advanced features to enrich your learning experience.

Free

For learners who aren't pressed for time

What's included on Free
1000+ IELTS Tests & Samples
Instant IELTS Writing Task 1 & 2 Evaluation (2 times/month)
Instant IELTS Speaking Part 1, 2, & 3 Evaluation (5 times/month)
Instant IELTS Writing Task 1 & 2 Essay Generator (2 times/month)
500+ Dictation & Shadowing Exercises
100+ Pronunciation Exercises
Flashcards
Other Advanced Tools

Premium

For those serious about advancing their English proficiency, and for IELTS candidates aspiring to boost their band score by 1-2 points (especially in writing & speaking) in just 30 days or less

What's included on Premium
Save Your IELTS Test Progress
Unlock All Courses & Content
Unlimited AI Conversations
Unlimited AI Writing Enhancement Exercises
Unlimited IELTS Writing Task 1 & 2 Evaluation
Unlimited IELTS Speaking Part 1, 2, & 3 Evaluation
Checked Answers Will Not Be Published
Unlimited IELTS Writing Task 1 & 2 Essay Generator
Unlimited IELTS Speaking Part 1, 2, & 3 Sample Generator
Unlimited Usage Of Advanced Tools

Due to the nature of our service and the provided free trials, payments are non-refundable.
Nếu bạn là người Việt Nam và không có hoặc không muốn trả bằng credit/debit cards, bạn có thể thanh toán bằng phương thức chuyển khoản:


Chọn gói:
279,000₫ 157,000 ₫ cho gói 1 tháng (chỉ 5,233₫/ngày)
819,000₫ 397,000 ₫ cho gói 3 tháng (chỉ 4,411₫/ngày)
1,649,000₫ 667,000 ₫ cho gói 6 tháng (chỉ 3,706₫/ngày)
3,299,000₫ 857,000 ₫ cho gói 12 tháng (chỉ 2,381₫/ngày)


Sau khi chuyển khoản, vui lòng đợi trình duyệt tự động điều hướng bạn trở lại Engnovate và bạn sẽ ngay lập tức nhận được mã kích hoạt tài khoản premium.
Nếu có lỗi xảy ra, bạn có thể liên hệ với team thông qua một trong các phương thức: email đến helloengnovate@gmail.com hoặc nhắn tin qua facebook.com/engnovate.
Vì toàn bộ công cụ trên website đều có thể sử dụng thử miễn phí, Engnovate không hỗ trợ hoàn tiền.