Our system will evaluate the answer based on this AI-generated description.
The image displays a table comparing key statistics across six major underground transit systems. It includes the following data for each: New York City Subway has 24 lines, a total network length of 659 miles, annual journeys totaling 1.65 billion, and a single ticket cost of $2.50. London Tube features 11 lines, 249 miles of track, 1.2 billion annual journeys, and a ticket price of $7.30. Tokyo Subway consists of 13 lines, spans 189 miles, sees 3.1 billion journeys per year, and charges $1.64 per ticket. Paris Metro operates 16 lines over 127 miles, accommodates 1.5 billion annual journeys, with tickets priced at $2.30. Mexico City Metro has 12 lines covering 140 miles, 1.6 billion journeys annually, and a minimal ticket cost of $0.23. Beijing Subway includes 19 lines, 357 miles long, 3.6 billion annual journeys, and a ticket priced at $0.45.
Given the complexity of the image, the above description may not be entirely accurate.
Skyrocket your IELTS band score by 1-2 points in under a month with our premium plan!
Note: Both the topic and the answer were created by one of our users.
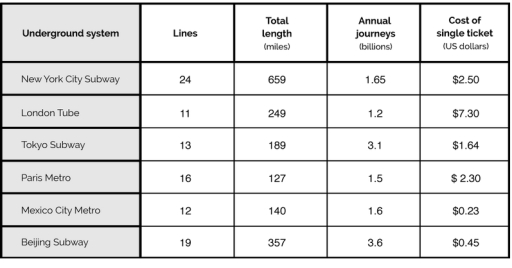
The table provides data on metro systems in six cities, comparing their network size, passenger volume, and ticket costs.
Overall, metro systems with larger networks do not necessarily have higher passenger numbers or fares. Notably, Beijing and Tokyo have the busiest systems, while London has the most expensive tickets despite a smaller network.
New York has the largest metro system, with 24 lines spanning 659 miles, yet its annual ridership (1.65 billion) is significantly lower than Tokyo (3.1 billion) and Beijing (3.6 billion), despite those cities having shorter networks. London, with only 11 lines and 249 miles of track, charges $7.30 per ticket, making it the most expensive system.
In contrast, Mexico City has the cheapest fare ($0.23) but still accommodates 1.6 billion annual journeys, surpassing London. Paris has the shortest network (127 miles) yet records 1.5 billion trips annually.
This data suggests a loose correlation between affordability and ridership, with Asian metros handling the most passengers at lower fares, while Western systems tend to have higher costs and fewer passengers.
Word Count: 171
