24 Hours Only: Get 39% OFF on Our Premium Plan - Check Out Now!
Table

Band 6+: The table below shows the attitudes to recycling of people in defferent age groups

Image for topic: The table below shows the attitudes to recycling of people in defferent age groups
Our system will evaluate the answer based on this AI-generated description.
The image contains a table outlining recycling attitudes across age groups, with percentages distributed as follows: age group 5-14 shows 8% actively recycle, 21% recycle when they remember, 52% don’t know anything about recycling, 19% preferred not to comment; age group 15-25 shows 59% actively recycle, 20% recycle when they remember, 8% don’t know anything about recycling, 13% preferred not to comment; age group 26-40 shows 48% actively recycle, 34% recycle when they remember, 7% don’t know anything about recycling, 14% preferred not to comment; age group 41-55 shows 47% actively recycle, 26% recycle when they remember, 7% don’t know anything about recycling, 20% preferred not to comment; age group 56-70 shows 39% actively recycle, 16% recycle when they remember, 28% don’t know anything about recycling, 17% preferred not to comment; age group 71+ shows 8% actively recycle, 34% recycle when they remember, 42% don’t know anything about recycling, 16% preferred not to comment.
Given the complexity of the image, the above description may not be entirely accurate.
Note: Both the topic and the answer were created by one of our users.

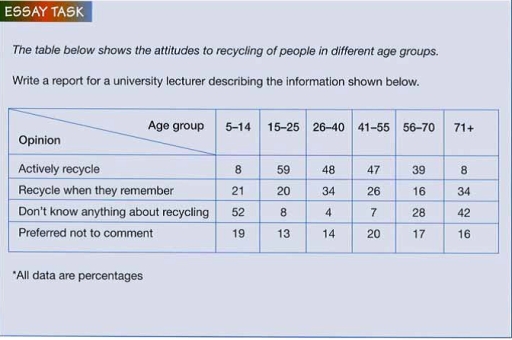
The perspective of varied age groups of people about recycling has been shown in the table.

Overall, it can be seen that a large proportion of the children and elderly people did not know about recyling and they recycled the least on active bases. While, the young to middle aged group of people knew much and actively recycled the most.

The pople aged from 15-25 recycled the most with a percentage of 59 and the the age group from 25-55 recycled second to it of about 48 percent. The 7-14 and people above 70 recycled the least percentage of 8. the 26-40 year old peopled had the highest proportion of recycling when they remember equal to the people above 70.

42 percent of 70 plus years old people did not know antything about recyling which is the second to 7-14 age group which stands at 52 percent. An average of 18 to 19 percent people declined to answer the question on recycling.

Word Count: 162

Answers On The Same Topic:

The table below shows the attitudes to recycling of people in defferent age groups

The table shows information about the percentage of opinion of the people on recycling in different age. Overall,it is clear that the proportion of recycle when they remember expirienced a high figure on each age given the table while preffered not to commment maintained tha same percentage. Another interesting point is that,the figure for actively […]

The table below shows the attitudes to recycling of people in defferent age groups

The table represents the percentages of people engaged in recycling among varied age groups. Overall, those commited in recycling are mostly from teenagers and adults to elderly. In contrast, groups who unfamiliar and inactive in recycling are seen in children and elderly. Groups that seldomly recycle and expressing no view are relatively concentrated within a […]

The table below shows the attitudes to recycling of people in defferent age groups

The bar chart illustrates 4 different attitudes of people between 5 and more 71 years old. Overall, the lead number of people in type actively recycle in 15-25 age and second one the highest number of people do not know anything about recycing in 5-14 age, while recycle when they remember was significant one. The […]

The table below shows the attitudes to recycling of people in defferent age groups

The table illustrates the attitude of people in different age groups toward recycling. The survey was conducted among people from the following age groups: 5-14, 15-25, 26-40, 41-55, 56-70, and 70+. All data is represented as a percentage. Overall, children in the 5-14 age group mostly don’t know anything about recycling, while people aged 15-25 […]

See All

Other Topics:

The tables show the average salaries of graduates and non-graduates in the UK in 2010.

The tabular chart illustrates the average wages of graduates and non-graduates in the UK in 2010. Overall, it is clear that the average salaries for graduates remained the highest as compared to non-graduates in all age groups. In detail, the pay of a graduate was €24,000 at 22, which later increased to €32,200 at 32 […]

The table below gives information on visitor statistics for 1996, 1998 and 2000 for various World Heritage sites in Australia.

The table chart compares the number of Australia visitor statistices across six different World Heritage sites – – great barrier reef, gentral easrern rainforest reserve, blue mountains, tasmania wilderness, shark bay and macquarle island – – over the 4-year period (in 1996,1998 and 2000). Overall, it is clear that great barrier reef was the primary […]

The table shows the export values of various products in 2009 and 2010 . Summarize the information by selecting and reporting the main features and make comparisons where relevant.

THE TABLE ILLUSTRATES TRADING OF DIFFERENDS GOODS FROM 2009 TO 2010. OVERALL, EQUIPMENT, TELECOMMUNITY AND METALS NOTICEBLY INCREASED, WHEREASE CLOTHING AND MANUFACTURING DROPPED. TOTAL RESULTS SHOWED A SMALL CHANGE. A SIGNIFICANT RISE WAS OBSERVED IN TELECOMMUNITY WHICH ROSE FROM 7.9 TO 12.7. THE PERCENTAGE OF CHANGING WAS 61%. THERE WAS A MODERATLY GREW OF EXPORTING […]

The line graph below shows the number of visitors (in millions) to three different museums in a European city between 2000 and 2020. 📈 Data (Figure) Year Museum A Museum B Museum C 2000 2.0 3.5 1.0 2005 2.5 3.0 1.5 2010 3.5 2.5 2.0 2015 4.0 2.0 3.5 2020 4.5 1.5 5.0

The line graph illustrates the number of visitors (in millions) to three different museums in a European city between 2000 and 2020. Overall, visitor numbers to Museum A and Museum C increased over the period, while Museum B experienced a steady decline. In 2000, Museum B had the highest number of visitors at 3.5 million, […]

The table below gives information about the average annual distance travelled by adults and the types of travel in 1977 and 2007. Summarise the information by selecting and reporting the main features and make comparisons where relevant.

The chart below provides data on the typical yearly distance travelled by adults and the varieties of travel throughout 1977 and 3 decades later. In essence, while there were minor differences between some of the numbers, the graph clearly delineates that cars, trains, and taxis started being used for even more significant distances. Additionally, except […]

The table below gives information about the average annual distance travelled by adults and the types of travel in 1977 and 2007. Summarise the information by selecting and reporting the main features and make comparisons where relevant.

The chart below provides data on the typical yearly distance travelled by adults and the varieties of travel throughout 1977 and 3 decades later. In essence, while there were minor differences between some of the numbers the graph clearly delineates that cars, trains, and taxis started being used for even more significant distances. Aditionally, except […]

See All
We have detected unusual activity on your device.
Please verify your identity to continue.
Note: This verification step won't sign you in. If you have a premium account, please log in to access the service as usual.
Google/Gmail Verification
Or verify using Email/Code
We've sent a verification code to:
youremail@gmail.com (Not your email?)
Enter it below to complete the verification process.
Ensure your email address is correct, your inbox is not full, and you check your spam folder. If no email arrives, consider using an alternative email.
You will need a Premium plan to perform your action!
Note: If you already have a premium account, please log in to access our services as usual.

Plans & Pricing

Our mission is to make quality education accessible and free for everyone.
However, to keep our hardworking team running and this service alive, we genuinely need your support!
By opting for a premium plan, not only do you sustain us in achieving the mission, but you also unlock advanced features to enrich your learning experience.

Free

For learners who aren't pressed for time

What's included on Free
1000+ IELTS Tests & Samples
Instant IELTS Writing Task 1 & 2 Evaluation (2 times/month)
Instant IELTS Speaking Part 1, 2, & 3 Evaluation (5 times/month)
Instant IELTS Writing Task 1 & 2 Essay Generator (2 times/month)
500+ Dictation & Shadowing Exercises
100+ Pronunciation Exercises
Flashcards
Other Advanced Tools

Premium

For those serious about advancing their English proficiency, and for IELTS candidates aspiring to boost their band score by 1-2 points (especially in writing & speaking) in just 30 days or less

What's included on Premium
Save Your IELTS Test Progress
Unlock All Courses & Content
Unlimited AI Conversations
Unlimited AI Writing Enhancement Exercises
Unlimited IELTS Writing Task 1 & 2 Evaluation
Unlimited IELTS Speaking Part 1, 2, & 3 Evaluation
Checked Answers Will Not Be Published
Unlimited IELTS Writing Task 1 & 2 Essay Generator
Unlimited IELTS Speaking Part 1, 2, & 3 Sample Generator
Unlimited Usage Of Advanced Tools

Due to the nature of our service and the provided free trials, payments are non-refundable.
Nếu bạn là người Việt Nam và không có hoặc không muốn trả bằng credit/debit cards, bạn có thể thanh toán bằng phương thức chuyển khoản:


Chọn gói:
279,000₫ 157,000 ₫ cho gói 1 tháng (chỉ 5,233₫/ngày)
819,000₫ 397,000 ₫ cho gói 3 tháng (chỉ 4,411₫/ngày)
1,649,000₫ 667,000 ₫ cho gói 6 tháng (chỉ 3,706₫/ngày)
3,299,000₫ 857,000 ₫ cho gói 12 tháng (chỉ 2,381₫/ngày)


Sau khi chuyển khoản, vui lòng đợi trình duyệt tự động điều hướng bạn trở lại Engnovate và bạn sẽ ngay lập tức nhận được mã kích hoạt tài khoản premium.
Nếu có lỗi xảy ra, bạn có thể liên hệ với team thông qua một trong các phương thức: email đến helloengnovate@gmail.com hoặc nhắn tin qua facebook.com/engnovate.
Vì toàn bộ công cụ trên website đều có thể sử dụng thử miễn phí, Engnovate không hỗ trợ hoàn tiền.