🔥 Today Only: Save 30% on Premium — Offer Ends Soon! - Upgrade Now!
Table

Band 4+: The table below shows the attitudes to recycling of people in defferent age groups

Image for topic: The table below shows the attitudes to recycling of people in defferent age groups
Our system will evaluate the answer based on this AI-generated description.
The image contains a table outlining recycling attitudes across age groups, with percentages distributed as follows: age group 5-14 shows 8% actively recycle, 21% recycle when they remember, 52% don’t know anything about recycling, 19% preferred not to comment; age group 15-25 shows 59% actively recycle, 20% recycle when they remember, 8% don’t know anything about recycling, 13% preferred not to comment; age group 26-40 shows 48% actively recycle, 34% recycle when they remember, 7% don’t know anything about recycling, 14% preferred not to comment; age group 41-55 shows 47% actively recycle, 26% recycle when they remember, 7% don’t know anything about recycling, 20% preferred not to comment; age group 56-70 shows 39% actively recycle, 16% recycle when they remember, 28% don’t know anything about recycling, 17% preferred not to comment; age group 71+ shows 8% actively recycle, 34% recycle when they remember, 42% don’t know anything about recycling, 16% preferred not to comment.
Given the complexity of the image, the above description may not be entirely accurate.
Note: Both the topic and the answer were created by one of our users.

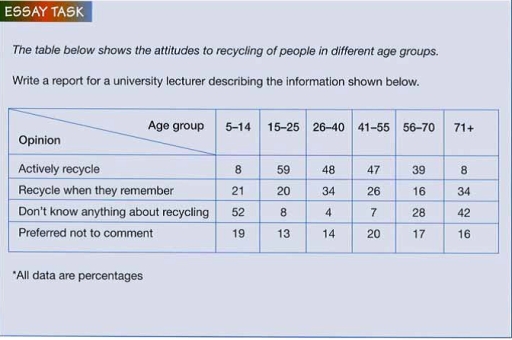
The bar chart illustrates 4 different attitudes of people between 5 and more 71 years old.

Overall, the lead number of people in type actively recycle in 15-25 age and second one the highest number of people do not know anything about recycing in 5-14 age, while recycle when they remember was significant one. The least number of people preferred not to comment.

As regards actively recycle, the highest number was 59 between 15-25 and between 26-70 years old people was significant number from 39 to 48. The least number of people both are similar 8, 5 to 14 and more 71 years old. Other significant number in group recycle when they remember, the highest number both 34, 26-40 and 71+ years old. In 41-55 is 26 people,second less number of people from 5-25 age from 20 to 21. The least one is 16 in age group 56-70.

Regarding prefered not to comment type of people, the highest one is 20 in age group 41-55, second one constitute 17-19 in the youngest age and 56-70. the least number of people 13 to 16 in different age groups. Notably, the highest number 52 in age 5 to 14 in attitude group do not know anything about recycling, then the significant number were 28 to 42 between 56 to 71+ age types. the smaller number of people 4 to 8 in age group 15 to 55 age.

Word Count: 235

Answers On The Same Topic:

The table below shows the attitudes to recycling of people in defferent age groups

The perspective of varied age groups of people about recycling has been shown in the table. Overall, it can be seen that a large proportion of the children and elderly people did not know about recyling and they recycled the least on active bases. While, the young to middle aged group of people knew much […]

The table below shows the attitudes to recycling of people in defferent age groups

The table shows information about the percentage of opinion of the people on recycling in different age. Overall,it is clear that the proportion of recycle when they remember expirienced a high figure on each age given the table while preffered not to commment maintained tha same percentage. Another interesting point is that,the figure for actively […]

The table below shows the attitudes to recycling of people in defferent age groups

The table represents the percentages of people engaged in recycling among varied age groups. Overall, those commited in recycling are mostly from teenagers and adults to elderly. In contrast, groups who unfamiliar and inactive in recycling are seen in children and elderly. Groups that seldomly recycle and expressing no view are relatively concentrated within a […]

The table below shows the attitudes to recycling of people in defferent age groups

The table illustrates the attitude of people in different age groups toward recycling. The survey was conducted among people from the following age groups: 5-14, 15-25, 26-40, 41-55, 56-70, and 70+. All data is represented as a percentage. Overall, children in the 5-14 age group mostly don’t know anything about recycling, while people aged 15-25 […]

See All

Other Topics:

The table below gives average yearly weather statistics of four cities.

The table shows average annual weather statistics in four capital cities: Edinburgh, Paris, Helsinki, and Casablanca. The information given includes annual rainfall, the number of wet days, annual snowfall, the annual temperature range and the hours of sunlight per day. Overall, the rainiest city of this group is Edinburgh, while the most humid is Helsinki […]

The tables below give information about the consumption and production of potatoes in different world regions in 2006. Summarize the information by selecting and reporting the main features, and make comparisons where relevant.

The table show information about potato consumption and production in different region in 2006. Overall the table illustrate that the highest per person consumption in lg is in Europe . The lowest also per person consumption in kg is in Africa . In terms of production the asia/ ocenia had highest . Europe follow closely […]

the table below shows the results of survey of first-year students who take courses in a particular university

The table illustrates the percentage of students gave good ratings for different aspects of a university in three different years. Overall, it is clear that the highest proportions of rating witnessed by the print and electronic resources, while range of models offered had the significant lowest throughout the period. In detail, print resources accounted for […]

The chart below shows the percentage of households owning different types of technology in a country in 1995 and 2005. Summarise the information by selecting and reporting the main features, and make comparisons where relevant.

The chart illustrates the percentage if households owning different categories of technology in different countries in 1995 and 2005 . Overall , it’s clear that the mobile phone and internet access significantly incline more than television and computer between the 2 years in the essay i will explain widely about this chart . In 1995 […]

The chart below shows the number of hours worked per week by people in four different countries in 2002. Summarise the information by selecting and reporting the main features, and make comparisons where relevant.

The chart illustrates the number of hours worked per per in different countries in 2002 . Overall, the chart shows the weekly average hour between ( japan , USA , UK and , Germany ) in 2002 . In 2002 japan it clearly significant highest number by 42 hours per week while the average weekly […]

The graph below shows the percentage of people unemployed in the total labour workforce across 9 countries in 1994 and 2004.

The table illustrates the number of people who are unemployed in nine different countries in the year’s 1994 and 2004. Overall, it is evident that unemployment rate has decreased in many countries while in other countries it has increased. First of all, In 1994 the number of people who were unemployed is 2.8=7 in Japan […]

See All
We have detected unusual activity on your device.
Please verify your identity to continue.
Note: This verification step won't sign you in. If you have a premium account, please log in to access the service as usual.
Google/Gmail Verification
Or verify using Email/Code
We've sent a verification code to:
youremail@gmail.com (Not your email?)
Enter it below to complete the verification process.
Ensure your email address is correct, your inbox is not full, and you check your spam folder. If no email arrives, consider using an alternative email.
You will need a Premium plan to perform your action!
Note: If you already have a premium account, please log in to access our services as usual.

Plans & Pricing

Our mission is to make quality education accessible for everyone.
However, to keep our hardworking team running and this service alive, we genuinely need your support!
By opting for a premium plan, not only do you sustain us in achieving the mission, but you also unlock advanced features to enrich your learning experience.

Free

For learners who aren't pressed for time

What's included on Free
100+ Cambridge IELTS Tests
Instant IELTS Writing Task 1 & 2 Evaluation (2 times/month)
Instant IELTS Speaking Part 1, 2, & 3 Evaluation (5 times/month)
Instant IELTS Writing Task 1 & 2 Essay Generator (2 times/month)
500+ Dictation & Shadowing Exercises
100+ Pronunciation Exercises
Flashcards
Other Advanced Tools

Premium

For those serious about advancing their English proficiency, and for IELTS candidates aspiring to boost their band score by 1-2 points (especially in writing & speaking) in just 30 days or less

What's included on Premium
Save Your IELTS Test Progress
Unlock All Courses & IELTS Tests
Unlimited AI Conversations
Unlimited AI Writing Enhancement Exercises
Unlimited IELTS Writing Task 1 & 2 Evaluation
Unlimited IELTS Speaking Part 1, 2, & 3 Evaluation
Checked Answers Will Not Be Published
Unlimited IELTS Writing Task 1 & 2 Essay Generator
Unlimited IELTS Speaking Part 1, 2, & 3 Sample Generator
Unlimited Usage Of Advanced Tools
Priority Support within 24h (12-month plan only)

Due to the nature of our service and the provided free trials, payments are non-refundable.
Nếu bạn là người Việt Nam và không có hoặc không muốn trả bằng credit/debit cards, bạn có thể thanh toán bằng phương thức chuyển khoản:


Chọn gói:
419,000₫ 277,000 ₫ cho gói 1 tháng (chỉ 9,233₫/ngày)
1,239,000₫ 597,000 ₫ cho gói 3 tháng (chỉ 6,633₫/ngày)
2,469,000₫ 1,027,000 ₫ cho gói 6 tháng (chỉ 5,706₫/ngày)
4,929,000₫ 1,417,000 ₫ cho gói 12 tháng (chỉ 3,936₫/ngày)


Sau khi chuyển khoản, vui lòng đợi trình duyệt tự động điều hướng bạn trở lại Engnovate và bạn sẽ ngay lập tức nhận được mã kích hoạt tài khoản premium.
Nếu có lỗi xảy ra, bạn có thể liên hệ với team thông qua một trong các phương thức: email đến helloengnovate@gmail.com hoặc nhắn tin qua facebook.com/engnovate.
Vì toàn bộ công cụ trên website đều có thể sử dụng thử miễn phí, Engnovate không hỗ trợ hoàn tiền.