Our system will evaluate the answer based on this AI-generated description.
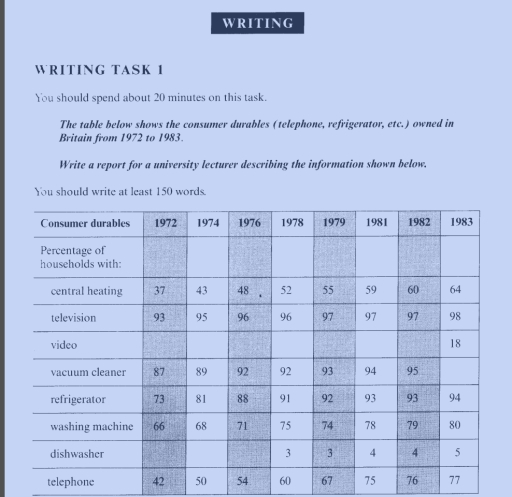
The image contains a table detailing the percentage of British households owning specific consumer durables from 1972 to 1983. Central heating ownership: 37% in 1972, 43% in 1974, 48% in 1976, 52% in 1978, 55% in 1979, 59% in 1981, 60% in 1982, 64% in 1983. Television ownership: 93% in 1972, 95% in 1974, 96% in 1976, 96% in 1978, 97% in 1979, 97% in 1981, 97% in 1982, 98% in 1983. Video ownership starts at 18% in 1983. Vacuum cleaner ownership: 87% in 1972, 89% in 1974, 92% in 1976, 92% in 1978, 93% in 1979, 94% in 1981, 95% in 1982 and 1983. Refrigerator ownership: 73% in 1972, 81% in 1974, 85% in 1976, 91% in 1978, 92% in 1979, 93% in 1981, and 94% in 1982 and 1983. Washing machine ownership: 66% in 1972, 68% in 1974, 71% in 1976, 75% in 1978, 74% in 1979, 78% in 1981, 79% in 1982, 80% in 1983. Dishwasher ownership: 3% in 1978, 3% in 1979 and 1981, 4% in 1982, 5% in 1983. Telephone ownership: 42% in 1972, 50% in 1974, 54% in 1976, 60% in 1978, 67% in 1979, 75% in 1981, 76% in 1982, 77% in 1983.
Given the complexity of the image, the above description may not be entirely accurate.
Skyrocket your IELTS band score by 1-2 points in under a month with our premium plan!
Note: Both the topic and the answer were created by one of our users.
The table ilustrates the percentage of consumer durables in Britain in eight academic years: from 1972-1983 for using households such as central heating, television, video, vacuum cleaner, refrigerator, washing machine, dishwasher and telephone.
Overall, television was more popular consumed by the citizens in Britain than others households throughout the periods. Television increased consistently in 1972 until 1979, remained stable for three years (1979-1982), and increased 1% by 1983. In contrast, Video had the smalllest percentage for all the electronic tools provided in the table.
On the one hand, there were four biggest percentage which residents in Britain liked to use namely Television, Vacuum Cleaner, Refrigerator and washing machines.The interesting part was that all of the households sometime rose and in another year remainedsteady.
On the other hand, the less popular household category were Central heating, dishwasher, telephone, and video. However, they showed significant increase every year.
In conclusion, the table describes that people in Britain used most of their time to watch Television in their daily life while video was the least popular.
Word Count: 173