🔥 Today Only: Save 30% on Premium — Offer Ends Soon! - Upgrade Now!
Table

Band 5+: The table below shows the consumer durables (telephone, refrigerator, etc. owned in Britain from 1972 to 1983

Image for topic: The table below shows the consumer durables (telephone, refrigerator, etc. owned in Britain from 1972 to 1983
Our system will evaluate the answer based on this AI-generated description.
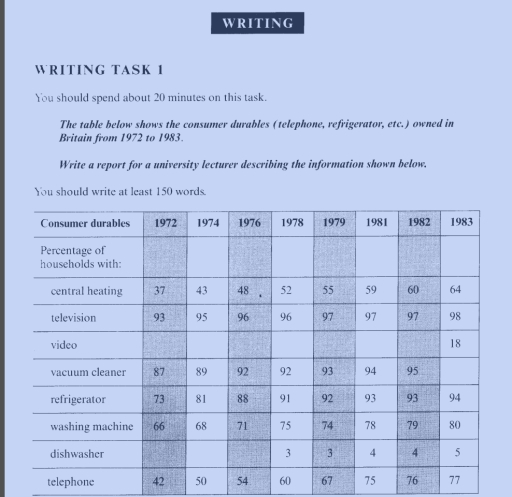
The image contains a table detailing the percentage of British households owning specific consumer durables from 1972 to 1983. Central heating ownership: 37% in 1972, 43% in 1974, 48% in 1976, 52% in 1978, 55% in 1979, 59% in 1981, 60% in 1982, 64% in 1983. Television ownership: 93% in 1972, 95% in 1974, 96% in 1976, 96% in 1978, 97% in 1979, 97% in 1981, 97% in 1982, 98% in 1983. Video ownership starts at 18% in 1983. Vacuum cleaner ownership: 87% in 1972, 89% in 1974, 92% in 1976, 92% in 1978, 93% in 1979, 94% in 1981, 95% in 1982 and 1983. Refrigerator ownership: 73% in 1972, 81% in 1974, 85% in 1976, 91% in 1978, 92% in 1979, 93% in 1981, and 94% in 1982 and 1983. Washing machine ownership: 66% in 1972, 68% in 1974, 71% in 1976, 75% in 1978, 74% in 1979, 78% in 1981, 79% in 1982, 80% in 1983. Dishwasher ownership: 3% in 1978, 3% in 1979 and 1981, 4% in 1982, 5% in 1983. Telephone ownership: 42% in 1972, 50% in 1974, 54% in 1976, 60% in 1978, 67% in 1979, 75% in 1981, 76% in 1982, 77% in 1983.
Given the complexity of the image, the above description may not be entirely accurate.
Note: Both the topic and the answer were created by one of our users.

The table depicts the percentages of eight types of consumer uses of household in Britain, in 1972 and 1983. Overall, the percentages of consumer durables was increase from the beginning until the period given, except for washing machine in 1979. The majority of household mostly consume television, while the least spent was for dishwaser and video.

Household in Britain mostly used of television in their home. From 1972, they consume 93% and it increased 2%, which is become (95%) in 1974. In 1976 and 1978, it was rose until 96%, and the next three years, it rose 1% again, (97%). At the end of the year, the percentage rose until 98%.

Dishwaser and video were the least consumeable. In the first three years, the household not using any dishwaser. Meanwhile, television only being used in the last period given (1983), they consume 18%. In 1978 and 1979, the dishwaser was slightly grow until 3%, in 1981 and 1982 it accounted for 4%, and the last year it was peak until 5%.

Word Count: 171

Answers On The Same Topic:

The table below shows the consumer durables (telephone, refrigerator, etc. owned in Britain from 1972 to 1983

The provided table chart illustrates the data of household things that individuals owned in Britain from 1972 to 1983. Overall, it is evident that the most preferred item was television, while the least was video and dishwasher, in contrast to other things in which data was slightly rose. Turning to details, the count for central […]

The table below shows the consumer durables (telephone, refrigerator, etc. owned in Britain from 1972 to 1983

The provided table elucidate the consumer durable owning in United Kingdom between the years of 1972 to 1983. As an overall, it is noticeable here that deviation can be seen throughout the period. To commence, in the start four years of the given period fluctuation can be detected in the percentage of all households. However, […]

The table below shows the consumer durables (telephone, refrigerator, etc. owned in Britain from 1972 to 1983

The table illustrates the ownership of consumer durables such as central heating, television, video, etc. in Britain from 1972 to 1983. Overall, the ownership of consumer durables increased during this period. The biggest increases between the two years were in telephone and refrigerator ownership. Television was the most common in all the years. In 1972, […]

The table below shows the consumer durables (telephone, refrigerator, etc. owned in Britain from 1972 to 1983

The table chart compares the number of consumer durables ( Central heating, Television, Video, Vacuum cleaner, Refrigerator, Washing machine, Dishwasher, and Telephone) owned in Britain between 1972 to 19863. Overall, it is clear that Television number for the largest share of the Britain over the period, while Dishwasher accounted for the smallest share. Other categories […]

The table below shows the consumer durables (telephone, refrigerator, etc. owned in Britain from 1972 to 1983

The graph illustrates the percentage of households that owned various consumer durables from 1972 to 1983 in Britain. Overall, all the consumer durables increased steadily, although the extent of growth varied considerably. Televisions and vacuum cleaners were already widely owned by households in 1972, while central heating experienced the most substantial rise. By 1983, televisions, […]

See All

Other Topics:

The table below gives information about the situation of marriage and age from 1960 to 2000 in Australia. Summarise the information by selecting and reporting the main features, and make comparisons where relevant.

The chart below illustrates information about marrige condition in Australia from 1960 to 2000. Overall, it can be seen the number of religious marriage and civil generally increased year by year.In addition ,the avarage age of both brides and bridegrooms rose over the period. In 1960 religion marriage number was 25000 ,but in 1970 it […]

The table shows the different flat sizes along with living space per person in 1980s, 1990s and 2000s. Summarise the information by selecting and reporting the main features, and make comparisons where relevant.

The table provides information about the apartment flat sizes and living space for individuals in 1980s,1990s and 2000s. Overall, it can be noticed that the table conducts five different sections. Which shows the time period, flat types, floor areas, average household sizes and living space for per person. Moreover, household sizes reduce over the year […]

The table below shows the percentage of people in a city who used different forms of transport to travel to work in 2000, 2010 and 2020. Summarise the information by selecting and reporting the main features, and make comparisons where relevant.

The given table shows the percentage of people who used four diverse forms of transport to travel to work in 2000,2010 and 2020. It is clear that the proportion of car use declined significantly over the period, while the use of bus and bicycle rose gradually. Car use remained the most popular transportation throughout the […]

The table below shows the percentage of people in a city who used different forms of transport to travel to work in 2000, 2010 and 2020. Summarise the information by selecting and reporting the main features, and make comparisons where relevant.

The given table shows the percentage of people who used four diverse forms of transport to travel to work in 2000,2010 and 2020. It is clear that the proportion of car use declined significantly over the period, while the use of bus and bicycle rose gradually. Car use remained the most popular transportation throughout the […]

The table below shows the average salaries of teachers in five countries at the beginning of their career, after 15 years and the maximum salary.

The table compares the average incomes of employees until reaching the peak salary, measured in US dollars, in five different nations namely Australia, Denmark, Luxembourg, Japan and Korea. Overall, although Australia and Denmark achieve the maximum incomes faster than the other countries, they provide relatively lowest incomes levels; additionally, Luxembourg stands out from the table […]

The table below given the information about the underground railway systems in 6 countries.

The table provides data on the underground railway systems located in six major cities: the opening year, the length of the route (in kilometres), and the annual riderships (in millions). Overall, there is a correlation between the date opened and the total distance: the older a railway network, the longer its route, with the exception […]

See All
We have detected unusual activity on your device.
Please verify your identity to continue.
Note: This verification step won't sign you in. If you have a premium account, please log in to access the service as usual.
Google/Gmail Verification
Or verify using Email/Code
We've sent a verification code to:
youremail@gmail.com (Not your email?)
Enter it below to complete the verification process.
Ensure your email address is correct, your inbox is not full, and you check your spam folder. If no email arrives, consider using an alternative email.
You will need a Premium plan to perform your action!
Note: If you already have a premium account, please log in to access our services as usual.

Plans & Pricing

Our mission is to make quality education accessible for everyone.
However, to keep our hardworking team running and this service alive, we genuinely need your support!
By opting for a premium plan, not only do you sustain us in achieving the mission, but you also unlock advanced features to enrich your learning experience.

Free

For learners who aren't pressed for time

What's included on Free
100+ Cambridge IELTS Tests
Instant IELTS Writing Task 1 & 2 Evaluation (2 times/month)
Instant IELTS Speaking Part 1, 2, & 3 Evaluation (2 times/month)
Instant IELTS Writing Task 1 & 2 Essay Generator (2 times/month)
500+ Dictation & Shadowing Exercises
100+ Pronunciation Exercises
Flashcards
Other Advanced Tools

Premium

For those serious about advancing their English proficiency, and for IELTS candidates aspiring to boost their band score by 1-2 points (especially in writing & speaking) in just 30 days or less

What's included on Premium
Save Your IELTS Test Progress & Analyze Mistakes By Question Type
Save Your Own Flashcard Sets & Use Them On Any Device
Unlock All Courses, IELTS Tests, Section & Part Practice
Unlimited AI Conversations
Unlimited AI Writing Enhancement Exercises
Unlimited IELTS Writing Task 1 & 2 Evaluation
Unlimited IELTS Speaking Part 1, 2, & 3 Evaluation
Checked Answers Will Not Be Published
Unlimited IELTS Writing Task 1 & 2 Essay Generator
Unlimited IELTS Speaking Part 1, 2, & 3 Sample Generator
Unlimited Usage Of Advanced Tools & AI Features
Priority Support within 24h (12-month plan only)

Due to the nature of our service and the provided free trials, payments are non-refundable.