🔥 Today Only: Save 30% on Premium — Offer Ends Soon! - Upgrade Now!
Table

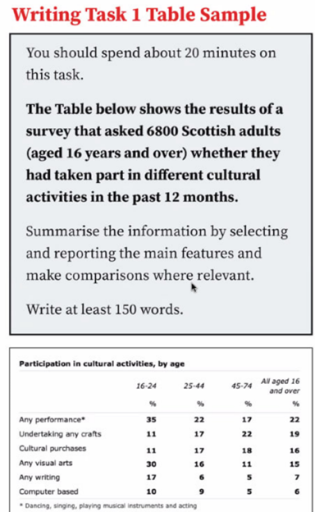
Band 6+: The table shows the results of a survey that asked 6800 Scottish adults (aged 16 years and over) whether they had taken part in different cultural activities in the past 12 months.

Image for topic: The table shows the results of a survey that asked 6800 Scottish adults (aged 16 years and over) whether they had taken part in different cultural activities in the past 12 months.
Our system will evaluate the answer based on this AI-generated description.
The image is a screenshot of a Writing Task 1 sample prompt, instructing the test-taker to spend 20 minutes summarizing a table that shows the results of a survey conducted on 6800 Scottish adults aged 16 years and over, about their participation in cultural activities in the past 12 months. The table is titled "Participation in cultural activities, by age" and has four age groups (16-24, 25-44, 45-64, and All aged 16 and over) with eight categories of cultural activities listed, including "Any performance," "Undertaking any crafts," "Any visual arts," "Cultural purchases," "Any writing," "Computer based," "Dancing, singing, playing musical instruments," and "Visiting based." Each category has a percentage of participation for each age group, with the highest participation overall being in "Any performance" (22% for ages 25-44 and All aged 16 and over). The lowest participation is in "Computer based" (5% for ages 45-64 and 6% for All aged 16 and over). The task requires a minimum of 150 words.
Given the complexity of the image, the above description may not be entirely accurate.
Note: Both the topic and the answer were created by one of our users.

The table demonstrates the different cultural activities were engaged among 6800 Scottish adults over a period of year.

Overall, the attendance in any performance recorded the highest figure among six categories mentioned, whereas computer based activity was the least popular in all age groups.

According to the table, any performance which involves dancing, singing, playing musical instruments and acting were the most dominant among three age groups, standing at 35%, 22% and 17% respectively. Any visual arts stood at the second rank. The ratio of individuals who are in the age between 16 and 24 was roughly twofold higher than the age from 25 to 44 when joining this type of activity (30%,16% for each). Any writing activity attracting the group between 16 and 24 years old consisted of 17%, higher than the group 25-44 age 11% and the last one was 12%. Computer based allocated the least throughout six types, at 10%, 9%, and 5% in turn.

The 16-24 age group rated for undertaking any crafts accounted for 11%, while the age from 25 to 44 was 17% and the 45 to 74 years old was 22%. Similarly, both group 16-24 and 25-44 had the same percentage as undertaking any crafts; however, the percentage of people who are in 45 to 74 took part in this activity was 18%.

Word Count: 220

Answers On The Same Topic:

The table shows the results of a survey that asked 6800 Scottish adults (aged 16 years and over) whether they had taken part in different cultural activities in the past 12 months.

The table illustrates the outcome of a survey in Scottish that 6800 younger people had different cultural activities in the past year. Overall, it can be clearly seen that the highest percentage of people activities was any performance, while computer based had the lowest participation in cultural events, by age, throughout the months. In terms […]

The table shows the results of a survey that asked 6800 Scottish adults (aged 16 years and over) whether they had taken part in different cultural activities in the past 12 months.

The table provides information on the percentage of Scottish adults, aged 16 and above, who participated in various cultural activities over the past 12 months, categorized by age group. Overall, it is clear that younger people were more likely to engage in active performances and visual arts, whereas older demographics preferred crafts and cultural purchases. […]

The table shows the results of a survey that asked 6800 Scottish adults (aged 16 years and over) whether they had taken part in different cultural activities in the past 12 months.

The table illustrates the results of a survey that asked 6800 Scottish adults (ages 16 years and over) whether they had taken part unsimilar cultural activities in the past 1 year. Overall, it is clearly seem that 16 and 24 ages spent time more activities than other group ages. In between 16 and 24 ages […]

The table shows the results of a survey that asked 6800 Scottish adults (aged 16 years and over) whether they had taken part in different cultural activities in the past 12 months.

The table chart provides information about the participation in cultural activities in four different age groups in the past 12 months. Overall, people aged 16 and 24 experienced the highest share for any performance, whereas computer based activities had the least percentage. In terms of any performance, the percentage of the 16-24 aged groups represented […]

The table shows the results of a survey that asked 6800 Scottish adults (aged 16 years and over) whether they had taken part in different cultural activities in the past 12 months.

The given table shows the past year’s result of the cultural activities participation survey passed for adults aged over 16 in Scotland, introduced percentage-wise. At first glance, it is clear that the group of people aged 16 to 24 introduced the dominating figures in most categories. Moreover, “any performance” events were the most attended for […]

See All

Other Topics:

The table shows information about students studying at an Australian university in 2009.

The table represents the popularity of different departments at a university in Australia in 2009, with a further classification by students’ gender, native languages, and nationality. Overall, female students preferred the humanities over science-related subjects, with the exception of physics. By contrast, science subjects held great appeal for students whose first language is not English […]

The three pie charts below show changes in annual spending at a public school in Canada in 1990, 2000, and 2010. Summarise the information by selecting and reporting the main features, and make comparisons where relevant.

The pie charts illustrate changes in the annual expenditure at a public school in Canada in three different years: 1990, 2000, and 2010. Overall, teachers’ salaries declined noticeably throughout the period; however, technology expenses increased significantly. Learning resources remained constant over the period. In 1990, teachers’ salaries accounted for more than half of expenditure at […]

The table gives information about the average hours spent on the internet by European people of different age groups.

The table compares the average amount of time, measured in hours, that European males and females across six different age demographics spend on the internet. Overall, internet usage is highest among teenagers, with males generally spending slightly more time online than females in younger age brackets. Conversely, older age groups spend significantly less time on […]

The table below gives information about changes in modes of travel in Netherland between 2001 and 2006.

The table compares how different modes of transportation used for travelling in the Netherlands developed from 2001 to 2006. Overall, most modes of transport experienced an upward trend, with cars remaining the most common choice throughout the period. Looking closer at the table, local distance buses and taxis began at 54 and 13 miles respectively […]

The table shows consumer spending items in five different countries in 2002.

THE TABLE DIAGRAM REPRESENTS INDIVIDUALS’ EXPENDITURES IN THREE CATEGORIES AMONG FIVE DIFFERENT NATIONS IN THE YEAR 2002. THE SCALE IS IN PERCENTAGE. OVERALL , IT IS EVIDENT THAT PEOPLE OF TURKEY SPEND MORE ON FOOD/DRINK/TOBACCO .HOWEVER,THE LEAST SPEND WAS MADE BY SPANIS PEOPLE FOR EDUCATIONS/LEISURE. ANOTHER THREE COUNTRIES RESIDERS ARE SPENDING AVERAGE . TO BEGIN […]

The table below gives information about consumer spending on different items in five different countries in 2002. Summarise the information by selecting and reporting the main features, and make comparisons where relevant.

The table compares the proportion of spending on three categories of goods and services across five countries, in 2002. Overall, it is clear that the category of food, drinks and tobacco accounted for the largest share of spending in all countries, while the lowest proportion of expenditure was seen in leisure and education. In terms […]

See All
We have detected unusual activity on your device.
Please verify your identity to continue.
Note: This verification step won't sign you in. If you have a premium account, please log in to access the service as usual.
Google/Gmail Verification
Or verify using Email/Code
We've sent a verification code to:
youremail@gmail.com (Not your email?)
Enter it below to complete the verification process.
Ensure your email address is correct, your inbox is not full, and you check your spam folder. If no email arrives, consider using an alternative email.
You will need a Premium plan to perform your action!
Note: If you already have a premium account, please log in to access our services as usual.

Plans & Pricing

Our mission is to make quality education accessible for everyone.
However, to keep our hardworking team running and this service alive, we genuinely need your support!
By opting for a premium plan, not only do you sustain us in achieving the mission, but you also unlock advanced features to enrich your learning experience.

Free

For learners who aren't pressed for time

What's included on Free
100+ Cambridge IELTS Tests
Instant IELTS Writing Task 1 & 2 Evaluation (2 times/month)
Instant IELTS Speaking Part 1, 2, & 3 Evaluation (2 times/month)
Instant IELTS Writing Task 1 & 2 Essay Generator (2 times/month)
500+ Dictation & Shadowing Exercises
100+ Pronunciation Exercises
Flashcards
Other Advanced Tools

Premium

For those serious about advancing their English proficiency, and for IELTS candidates aspiring to boost their band score by 1-2 points (especially in writing & speaking) in just 30 days or less

What's included on Premium
Save Your IELTS Test Progress & Analyze Mistakes By Question Type
Save Your Own Flashcard Sets & Use Them On Any Device
Unlock All Courses, IELTS Tests, Section & Part Practice
Unlimited AI Conversations
Unlimited AI Writing Enhancement Exercises
Unlimited IELTS Writing Task 1 & 2 Evaluation
Unlimited IELTS Speaking Part 1, 2, & 3 Evaluation
Checked Answers Will Not Be Published
Unlimited IELTS Writing Task 1 & 2 Essay Generator
Unlimited IELTS Speaking Part 1, 2, & 3 Sample Generator
Unlimited Usage Of Advanced Tools & AI Features
Priority Support within 24h (12-month plan only)

Due to the nature of our service and the provided free trials, payments are non-refundable.